标签:Power BI powerbi Add Portal dashboard report page
Add a Power BI report or dashboard to a web page in portal
You can add a Power BI report or dashboard to a web page in portal by using the powerbi Liquid tag. Use the powerbi tag in the Copy field on a web page or in the Source field on a web template.
If adding a Power BI report or dashboard created in the new workspace in Power BI, you must specify the authentication type as powerbiembedded in the powerbi Liquid tag.
Tip
This article explains how to add a Power BI report or dashboard using powerbi liquid tag. To add Power BI component on a webpage in your portal using the portals Studio, go to Add a Power BI component to a webpage using the portals Studio.
For example:
{% powerbi authentication_type:"powerbiembedded" path:"https://app.powerbi.com/groups/00000000-0000-0000-0000-000000000000/reports/00000000-0000-0000-0000-000000000001/ReportSection01" %}
Note
If you have specified AAD as the authentication type in powerbi Liquid tag, you must share it with the required users before adding the secure Power BI report or dashboard to a web page in portal. More information: Share Power BI workspace and Share Power BI dashboard and report.
Get the path of a dashboard or report
-
Sign in to Power BI.
-
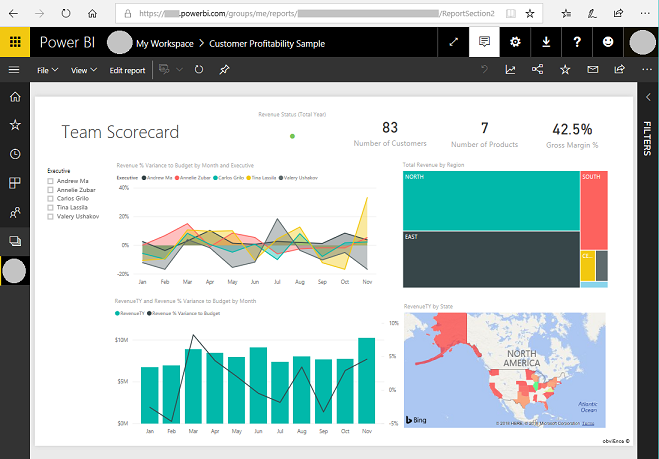
Open the dashboard or report you want to embed in your portal.
-
Copy URL from the address bar.

Get the ID of a dashboard tile
-
Sign in to Power BI.
-
Open the dashboard from which you want to embed a tile in your portal.
-
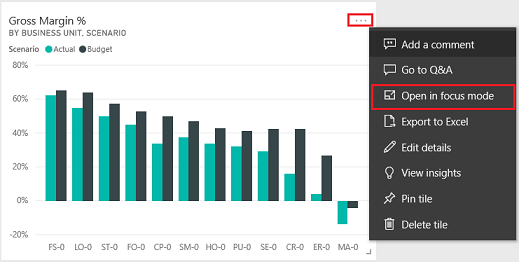
Point to the tile, select More options, and then select Open in focus mode.

-
Copy the tile ID from the URL in the address bar. The tile ID is the value after /tiles/.

How to use powerbi-client JavaScript library in portals
You can use powerbi-client JavaScript library while embedding Power BI reports or dashboards in portals. For more information about powerbi-client JavaScript library, see Power BI JavaScript wiki.
Below is a sample JavaScript to update the report settings, or to handle events. This sample disables filters pane, disables page navigation, and enables dataSelected event.
JavaScript$(function(){
var embedContainer = $(".powerbi")[0];
var report = powerbi.get(embedContainer);
report.on("loaded", function(){
report.updateSettings({
            panes: {
                filters :{
                    visible: false
                },
                pageNavigation:{
                    visible: false
                }
            }
        }).catch(function (errors) {
            console.log(errors);
        });
})
report.on('dataSelected', function(event){
console.log('Event - dataSelected:');
console.log(event.detail);
})
})
To add custom JavaScript to a web page:
- Open the Portal Management app.
- Select Web Pages from the left-pane.
- Select the web page that contains the Power BI report or dashboard.
- Select Advanced tab.
- Copy and paste the JavaScript inside the Custom JavaScript section.
- Select Save & Close.
Let's understand the sample JavaScript operations, and different options.
Get a reference to the embedded report HTML
Get a reference to the embedded report HTML.
JavaScriptvar embedContainer = $(".powerbi")[0];
More information: Get a reference to an existing Power BI component given the containing element
Get a reference to the embedded report
JavaScriptvar report = powerbi.get(embedContainer);
Work with Power BI panes
You can use the settings for panes to work with Power BI panes on a portals web page. For example, you can use the filters setting to hide or show the pane. Or, use the paging with page navigation setting.
Below is the sample to remove filters pane:
JavaScriptreport.updateSettings({
panes: {
filters :{
visible: false
}
}
}).catch(function (errors) {
console.log(errors);
});
Sample to work with both page navigation, and filters:
JavaScriptreport.updateSettings({
panes: {
filters :{
visible: false
},
pageNavigation:{
visible: false
}
}
}).catch(function (errors) {
console.log(errors);
});
More information: Update settings and Embed configuration - Settings
Handle events
The embedded component can emit events upon invoking a completion of an executed command. For example, below is a sample for dataSelected event.
//Report.off removes a given event listener if it exists
    report.off("dataSelected");
//Report.on will add an event list
    report.on('dataSelected', function(event){
        console.log('Event - dataSelected:');
        console.log(event.detail);
    })
More information: Handling events
标签:Power,BI,powerbi,Add,Portal,dashboard,report,page 来源: https://www.cnblogs.com/lingdanglfw/p/13958320.html
本站声明: 1. iCode9 技术分享网(下文简称本站)提供的所有内容,仅供技术学习、探讨和分享; 2. 关于本站的所有留言、评论、转载及引用,纯属内容发起人的个人观点,与本站观点和立场无关; 3. 关于本站的所有言论和文字,纯属内容发起人的个人观点,与本站观点和立场无关; 4. 本站文章均是网友提供,不完全保证技术分享内容的完整性、准确性、时效性、风险性和版权归属;如您发现该文章侵犯了您的权益,可联系我们第一时间进行删除; 5. 本站为非盈利性的个人网站,所有内容不会用来进行牟利,也不会利用任何形式的广告来间接获益,纯粹是为了广大技术爱好者提供技术内容和技术思想的分享性交流网站。
