标签:Vue name value 使用 main data echarts
Vue 中使用echarts
1.安装echarts
npm install echarts --save
2.在Vue中引入(全局引入) main.js
//全局引入echarts
import * as echarts from 'echarts';
//需要挂载到Vue原型上
Vue.prototype.$echarts = echarts
3.组件中使用
<template>
  <div class="home">
    <!-- 为 ECharts 准备一个定义了宽高的 DOM -->
    <div id="main" style="width: 600px;height:400px;"></div>
  </div>
</template>


'''

    id可以随便取

'''


<script>
//通过this.$echarts来使用
  export default {
    name: "page",
    mounted(){
        // 在通过mounted调用即可
        this.echartsInit()
    },
    methods: {
        //初始化echarts
        echartsInit() {
            //柱形图
            //因为初始化echarts 的时候,需要指定的容器 id='main'
            //使用时只需要把setOption里的对象换成echarts中的options(官网实例中复制)或者自己的参数即可
            this.$echarts.init(document.getElementById('main')).setOption({
                xAxis: {
                    type: 'category',
                    data: ['Mon', 'Tue', 'Wed', 'Thu', 'Fri', 'Sat', 'Sun']
                },
                yAxis: {
                    type: 'value'
                },
                series: [{
                    data: [120, 200, 150, 80, 70, 110, 130],
                    type: 'bar',
                    showBackground: true,
                    backgroundStyle: {
                        color: 'rgba(220, 220, 220, 0.8)'
                    }
                }]
            })
        }

    }
  }
</script>
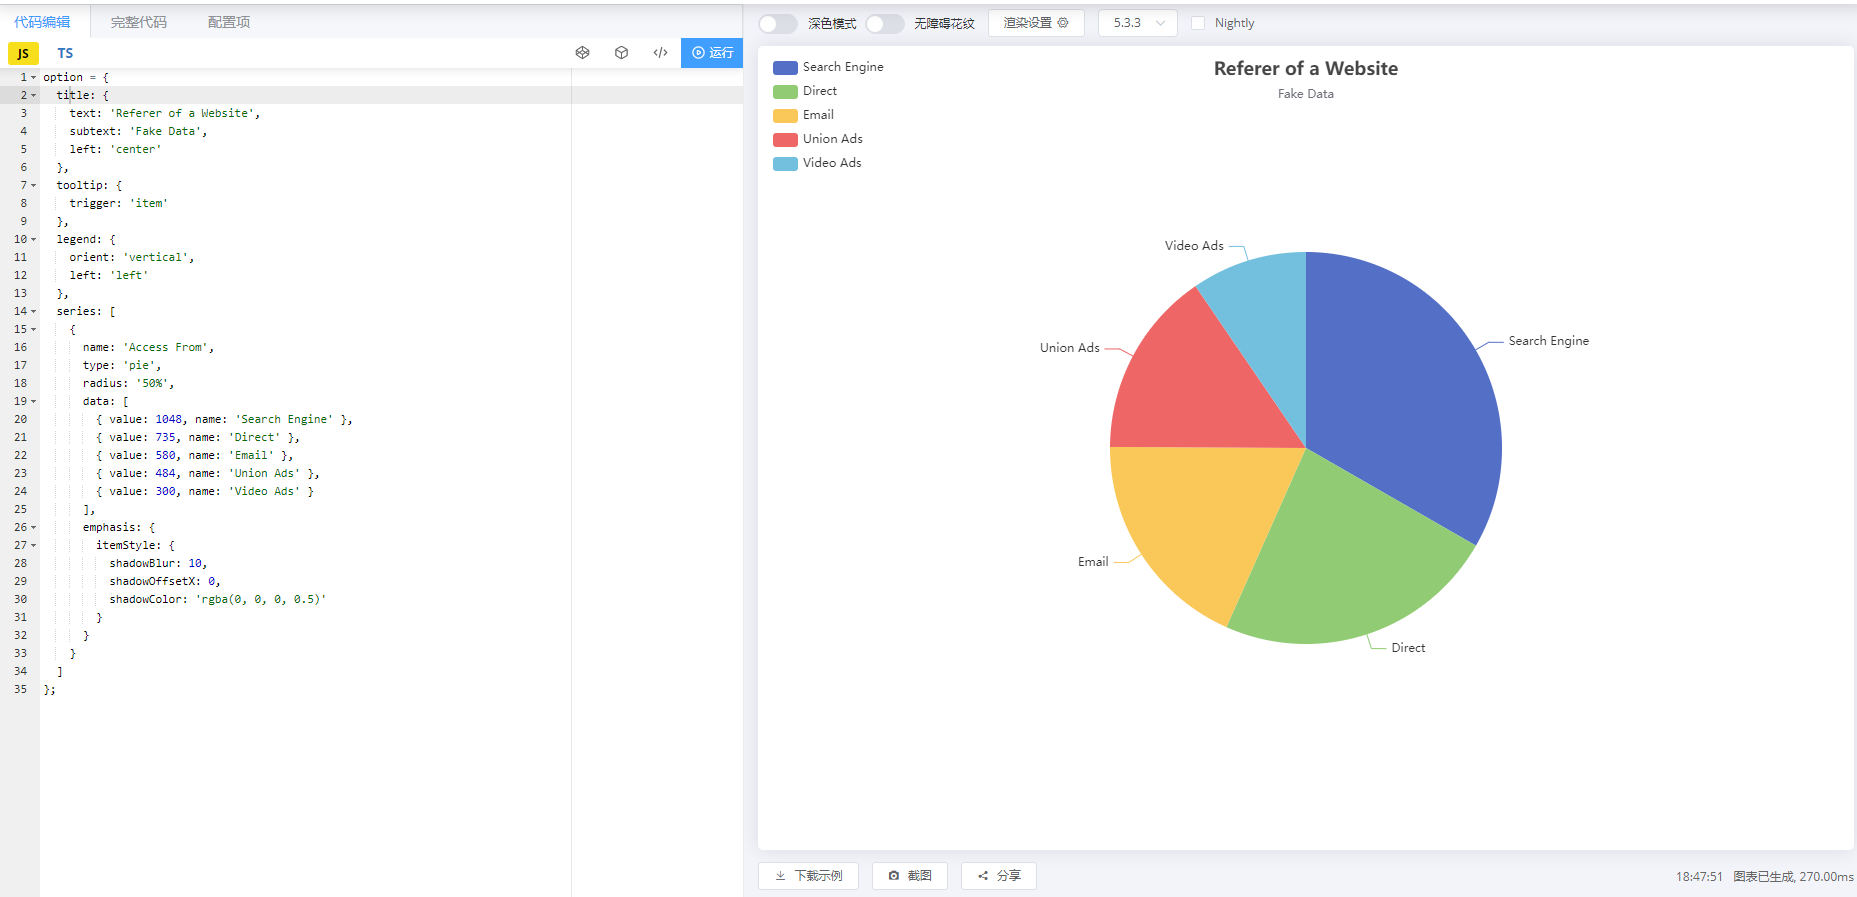
4.案例
以官网的饼图为例
1.安装echarts
npm install echarts --save
2.全局引用
//全局引入echarts
import * as echarts from 'echarts';
//全局引入axios
import axios from 'axios'
//需要挂载到Vue原型上
Vue.prototype.$echarts = echarts
Vue.prototype.$axios = axios
3.组件中使用
<template>
  <div class="home">
    <!-- 为 ECharts 准备一个定义了宽高的 DOM -->
    <div id="main" style="width: 600px;height:400px;"></div>
  </div>
</template>


<script>
// @ is an alias to /src
import * as echarts from 'echarts';


export default {
  name: 'HomeView',
  mounted() {
      '''

      		向后端发送请求,拿到数据

      '''
    this.$axios.get('http://127.0.0.1:8000/useragent/').then(respones => {
      for (var i = 0; i < respones.data.length; i++) {
        console.log(i)
        this.data_d.push({'value': respones.data[i].value, 'name': respones.data[i].name})
      }
      this.echartsInit() //在第一次渲染时执行函数
    })
      '''

      	 // this.echartsInit() 如果放在外面则不生效,必须放在回调函数中

      '''

  },
  data() {
    return {
      data_d: [],
    }
  },
  methods: {
    echartsInit() {
      //柱形图
      //因为初始化echarts 的时候,需要指定的容器 id='main'
      this.$echarts.init(document.getElementById('main')).setOption({
        title: {
          text: 'Referer of a Website',
          subtext: 'Fake Data',
          left: 'center'
        },
        tooltip: {
          trigger: 'item'
        },
        legend: {
          orient: 'vertical',
          left: 'left'
        },
        series: [
          {
            name: 'Access From',
            type: 'pie',
            radius: '50%',
            data: this.data_d,
              '''

              	data的格式为{'value':... , 'name':....},我们可以在后端序列化时就处理成对应的格式

              '''
            emphasis: {
              itemStyle: {
                shadowBlur: 10,
                shadowOffsetX: 0,
                shadowColor: 'rgba(0, 0, 0, 0.5)'
              }
            }
          }
        ]
      })
    }

  },
}
</script>
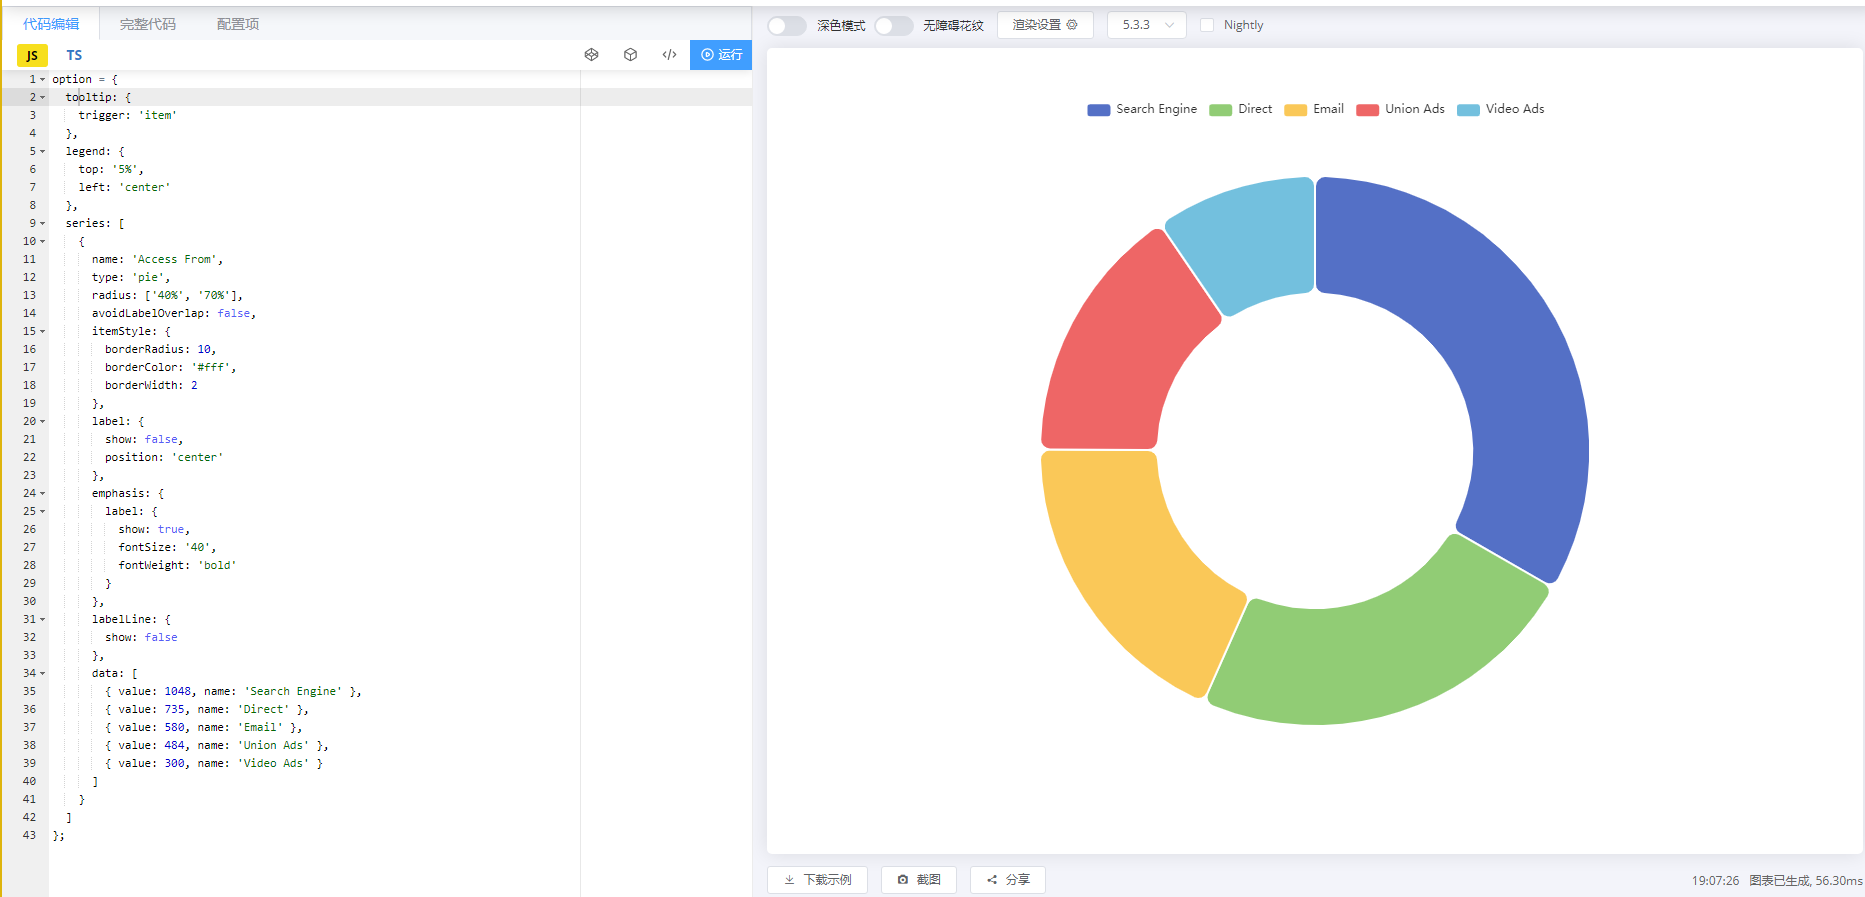
5.其他的如何使用
如果想要使用其他的,我们只需要修改
	  this.$echarts.init(document.getElementById('main')).setOption({

          '''

          		内容

          '''

      })即可
案例(改成以下)
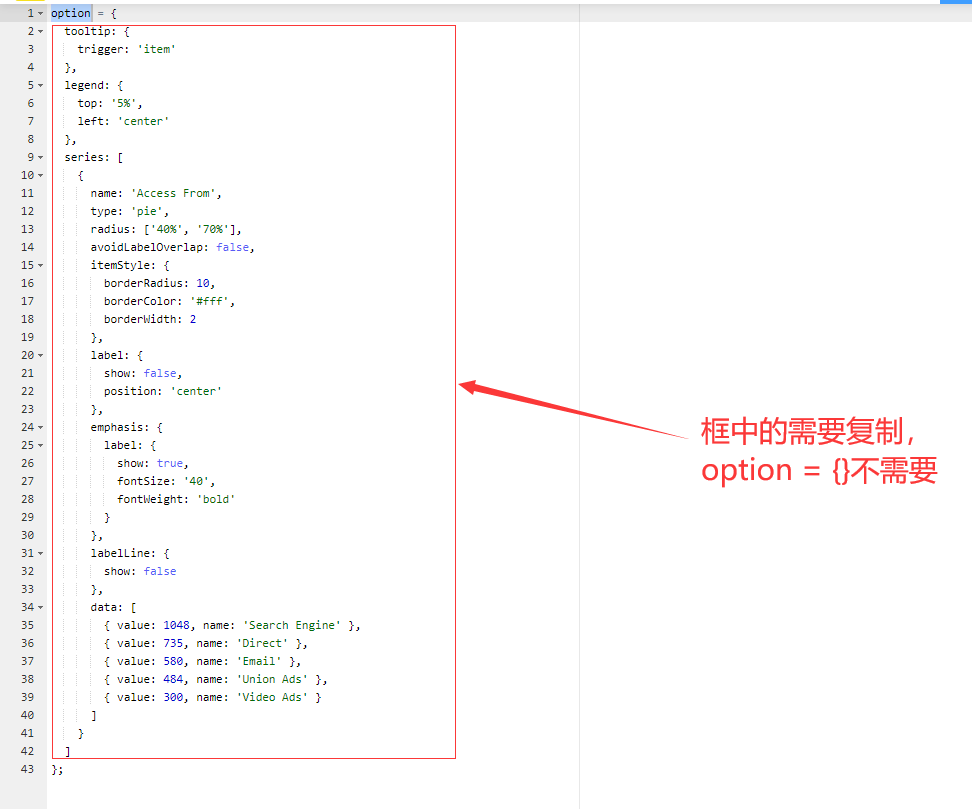
1.首先我们要复制option,option在左侧,也就是那些代码,都是我们不是全复制。具体复制内容如下图
2.粘贴对应位置
 this.$echarts.init(document.getElementById('main')).setOption({

     		  tooltip: {
                trigger: 'item'
              },
              legend: {
                top: '5%',
                left: 'center'
              },
              series: [
                {
                  name: 'Access From',
                  type: 'pie',
                  radius: ['40%', '70%'],
                  avoidLabelOverlap: false,
                  itemStyle: {
                    borderRadius: 10,
                    borderColor: '#fff',
                    borderWidth: 2
                  },
                  label: {
                    show: false,
                    position: 'center'
                  },
                  emphasis: {
                    label: {
                      show: true,
                      fontSize: '40',
                      fontWeight: 'bold'
                    }
                  },
                  labelLine: {
                    show: false
                  },
                  data: [
                    { value: 1048, name: 'Search Engine' },
                    { value: 735, name: 'Direct' },
                    { value: 580, name: 'Email' },
                    { value: 484, name: 'Union Ads' },
                    { value: 300, name: 'Video Ads' }
                  ]
                }
              ]

      })即可
标签:Vue,name,value,使用,main,data,echarts 来源: https://www.cnblogs.com/chunyouqudongwuyuan/p/16459424.html
本站声明: 1. iCode9 技术分享网(下文简称本站)提供的所有内容,仅供技术学习、探讨和分享; 2. 关于本站的所有留言、评论、转载及引用,纯属内容发起人的个人观点,与本站观点和立场无关; 3. 关于本站的所有言论和文字,纯属内容发起人的个人观点,与本站观点和立场无关; 4. 本站文章均是网友提供,不完全保证技术分享内容的完整性、准确性、时效性、风险性和版权归属;如您发现该文章侵犯了您的权益,可联系我们第一时间进行删除; 5. 本站为非盈利性的个人网站,所有内容不会用来进行牟利,也不会利用任何形式的广告来间接获益,纯粹是为了广大技术爱好者提供技术内容和技术思想的分享性交流网站。