标签:集成 console success await alert 华为 let error cordova
简介
AppGallery Connect(简称AGC)性能管理(APM,App Performance Management)服务提供分钟级应用性能监控能力,您可以在AGC查看和分析APM收集到的应用性能数据,实时全面掌握应用在线的性能表现,帮助您快速闭环应用的性能问题,持续提升应用的用户体验。
开通服务和集成SDK
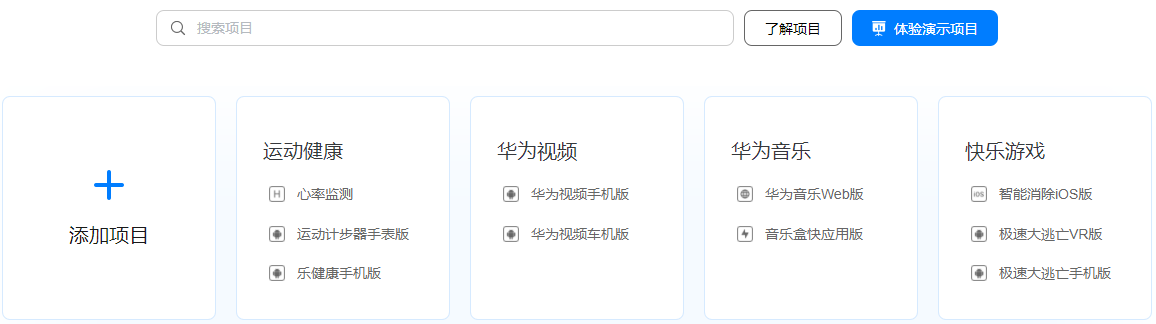
1、登录AppGallery Connect网站,点击“我的项目”。
2、在项目列表中找到您的项目,在项目下的应用列表中选择需要开通性能管理服务的应用。
3、进入“质量 > 性能管理”,如果APM服务未开通,请点击“立即开通”,开通APM服务。

4、选择常规页签下的“应用”区域,下载agconnect-services配置文件。
Android:下载agconnect-services.json文件。
iOS:下载agconnect-services.plist文件。
5、在Cordova开发项目中添加配置文件。
Android:将配置文件agconnect-services.json添加到Cordova项目的android/app目录下。
iOS:用Xcode打开Cordova项目的iOS模块,将配置文件agconnect-services.plist添加进项目。
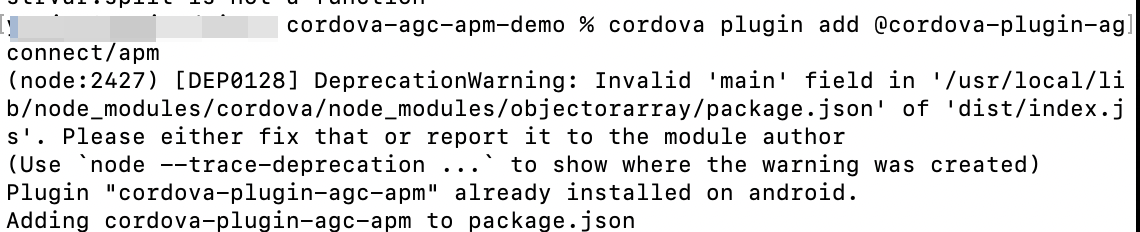
6、在Cordova项目的pubspec.yaml文件中添加依赖。
cordova plugin add @cordova-plugin-agconnect/apm
7、安装成功效果如下图。
界面设计
您可以在Cordova项目中创建一个布局页面,参照下图进行设计。
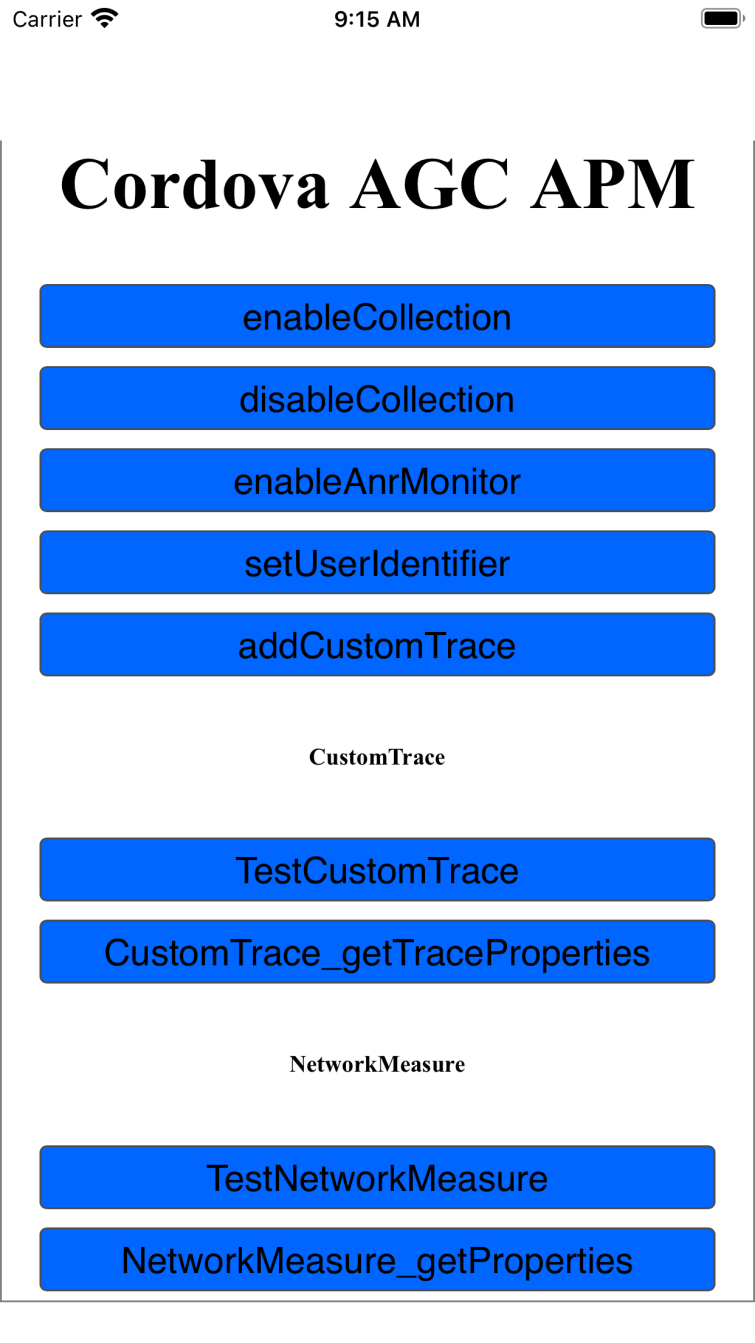
功能按钮如下:
- 开启和关闭收集性能监控数据按钮
- 启用ANR监控功能按钮
- 将用户ID与报告的数据绑定按钮
- 设置参数追踪按钮
- 测试参数追踪、网络请求按钮
功能开发
1、您初始化APMS实例。
async function onDeviceReady() {
   // Cordova is now initialized. Have fun!
   console.log("Running cordova-" + cordova.platformId + "@" + cordova.version);
   apmsPlugin = await AGCAPM.getInstance();
   alert("AGCAPM: initialized");
}
2、设置是否启用APM来收集性能监控数据。如果此参数设置为true,APM将收集应用性能数据。设置成false,则停止收集。
$("enableCollection").onclick = () => {
   let enable = true;
   apmsPlugin.enableCollection(enable).then(() => {
      alert("enableCollection: success");
   }).catch((error) => alert("enableCollection :: Error! " + JSON.stringify(error, null, 1)));
}
$("disableCollection").onclick = () => {
   let enable = false;
   apmsPlugin.enableCollection(enable).then(() => {
      alert("disableCollection: success");
   }).catch((error) => alert("disableCollection :: Error! " + JSON.stringify(error, null, 1)));
}
3、设置是否启用ANR监控功能。参数设置为true,表示启用了ANR 监控并报告了数据。要禁用ANR监控,将此参数设置为false。
$("enableAnrMonitor").onclick = () => {
   let enable = true;
   apmsPlugin.enableAnrMonitor(enable).then(() => {
      alert("enableAnrMonitor: success");
   }).catch((error) => alert("enableAnrMonitor :: Error! " + JSON.stringify(error, null, 1)));
}
4、将用户ID与报告的数据绑定。报告性能数据时,还报告用户 ID 以方便故障定位。
$("setUserIdentifier").onclick = () => {
   let userIdentifier = "HUAWEIuserIdentifier" + Math.floor(Math.random() * 1001);
   apmsPlugin.setUserIdentifier(userIdentifier).then(() => {
      alert("setUserIdentifier: success");
   }).catch((error) => alert("setUserIdentifier :: Error! " + JSON.stringify(error, null, 1)));
}
5、根据输入参数在应用中创建特定场景的自定义跟踪。您可以调用createCustomTrace接口创建自定义跟踪记录。创建完成后,可调用start接口启动自定义跟踪记录,调用stop接口停止自定义跟踪记录。
function traceTestSumFunc(num1, num2) {
   return new Promise((resolve, reject) => {
      for (let i = 0; i < num2; i++) {
         num1 += i;
      }
      resolve(num1 + num2);
   });
}
$("addCustomTrace").onclick = () => {
   let ctname = "addCustomTraceTestFunc" + Math.floor(Math.random() * 1001);
   AGCAPM.addCustomTrace(traceTestSumFunc(7, 90000000), ctname, true).then((res) => {
      alert("addCustomTrace: success :: " + res);
   }).catch((error) => alert("addCustomTrace :: Error! " + JSON.stringify(error, null, 1)));
}
$("testCustomTrace").onclick = () => {
   let traceName = "TNtraceName" + Math.floor(Math.random() * 1001);
   apmsPlugin.createCustomTrace(traceName).then(async (customTrace) => {
      mCustomTrace = customTrace;
      await mCustomTrace.start();
      console.log("ct_start: success ");

      let propertyName1 = "propertyName1";
      let propertyValue1 = "propertyValue1";
      await mCustomTrace.putProperty(propertyName1, propertyValue1);
      console.log("putProperty: success ");

      let propertyName2 = "propertyName2";
      let propertyValue2 = "propertyValue2";
      await mCustomTrace.putProperty(propertyName2, propertyValue2);
      console.log("putProperty: success ");

      let measureName1 = "measureName1";
      let measureValue1 = "1";
      await mCustomTrace.incrementMeasure(measureName1, measureValue1);
      console.log("incrementMeasure: success ");

      let measureName2 = "measureName2";
      let measureValue2 = "1";
      await mCustomTrace.putMeasure(measureName2, measureValue2);
      console.log("putMeasure: success ");

      await traceTestSumFunc(11, 90000000);
      await mCustomTrace.stop();
      alert("testCustomTrace: success");

      }).catch((error) => alert("testCustomTrace :: Error! " + JSON.stringify(error, null, 1)));
}
6、您可以调用createNetworkMeasure接口创建网络请求指标。创建完成后,可调用start接口启动该指标,调用stop接口停止该指标。您还可以调用putProperty接口为网络请求指标添加自定义属性。
$("testNetworkMeasure").onclick = () => {
   let url = "https://jsonplaceholder.typicode.com/todos";
   let httpMethod = "GET";
   apmsPlugin.createNetworkMeasure(url, httpMethod).then(async (networkMeasure) => {
      mNetworkMeasure = networkMeasure;

      await mNetworkMeasure.start();
      console.log("start: success ");

      const xhr = new XMLHttpRequest();
      xhr.open(httpMethod, url);
      xhr.send();
      xhr.onload = async function () {
         console.log(this.responseText);
         statusCode = this.status;
         await mNetworkMeasure.setStatusCode(statusCode);
         console.log("setStatusCode: success ");

         let contentType = "application/json";
         await mNetworkMeasure.setContentType(contentType);
         console.log("setContentType: success ");

         let bytesSent = "0";
         await mNetworkMeasure.setBytesSent(bytesSent);
         console.log("setBytesSent: success ");

         let bytesReceived = xhr.response.length.toString();
         await mNetworkMeasure.setBytesReceived(bytesReceived);
         console.log("setBytesReceived: success ");

         let propertyName1 = "propertyName1";
         let propertyValue1 = "propertyValue1";
         await mNetworkMeasure.putProperty(propertyName1, propertyValue1);

         let propertyName2 = "propertyName2";
         let propertyValue2 = "propertyValue2";
         await mNetworkMeasure.putProperty(propertyName2, propertyValue2);
         console.log("putProperty: success ");

         await mNetworkMeasure.stop();
         console.log("stop: success ");

         alert("testNetworkMeasure: success");
      }
   }).catch((error) => alert("testNetworkMeasure :: Error! " + JSON.stringify(error, null, 1)));
}
查看和分析性能数据
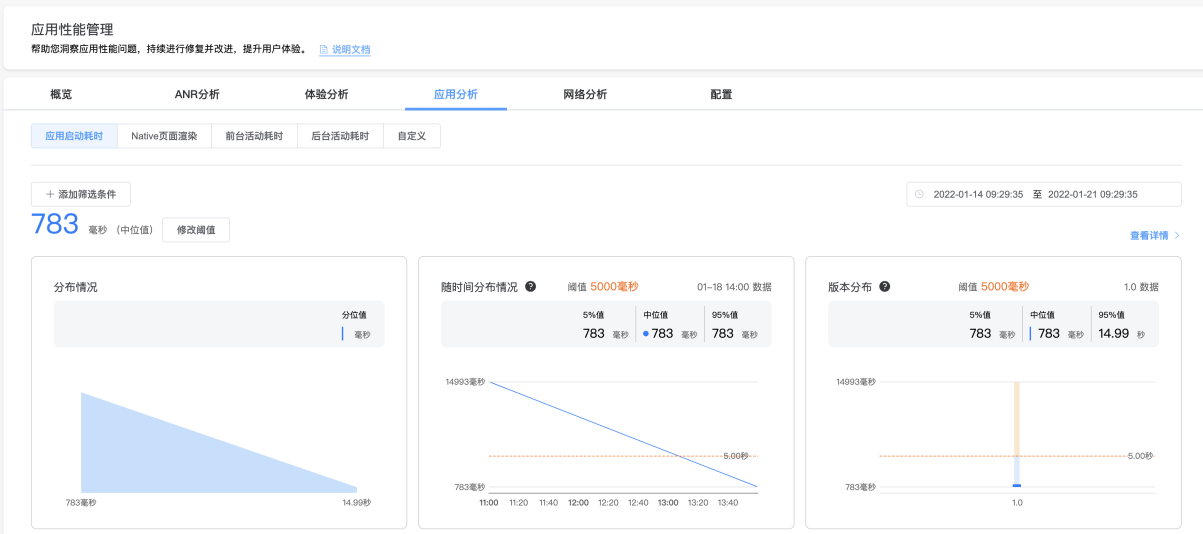
1、选择“质量 > 性能管理”,进入“应用性能管理”页面。点击“概览",进入概览页面,可以看到指标概览。指标概览包括“应用启动耗时”、“冻结帧占比”、“屏幕加载耗时”、“屏幕呈现耗时”和“用户ANR率”。
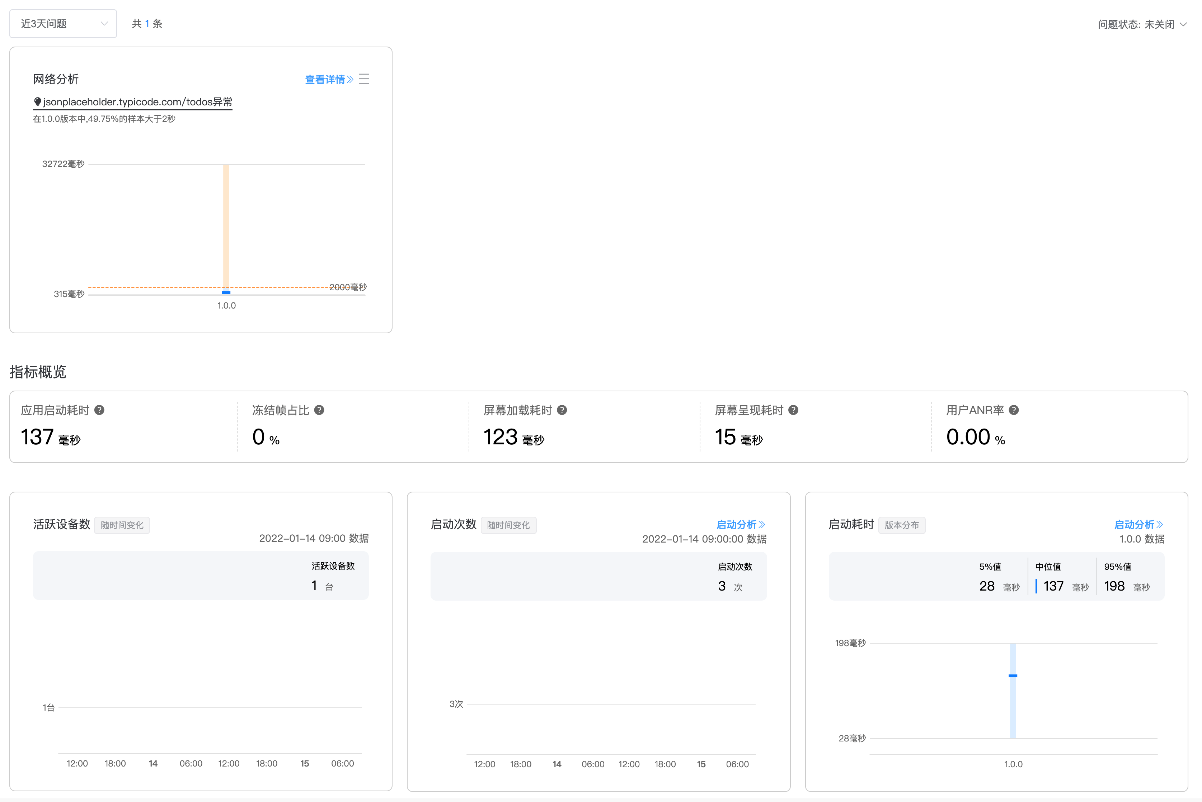
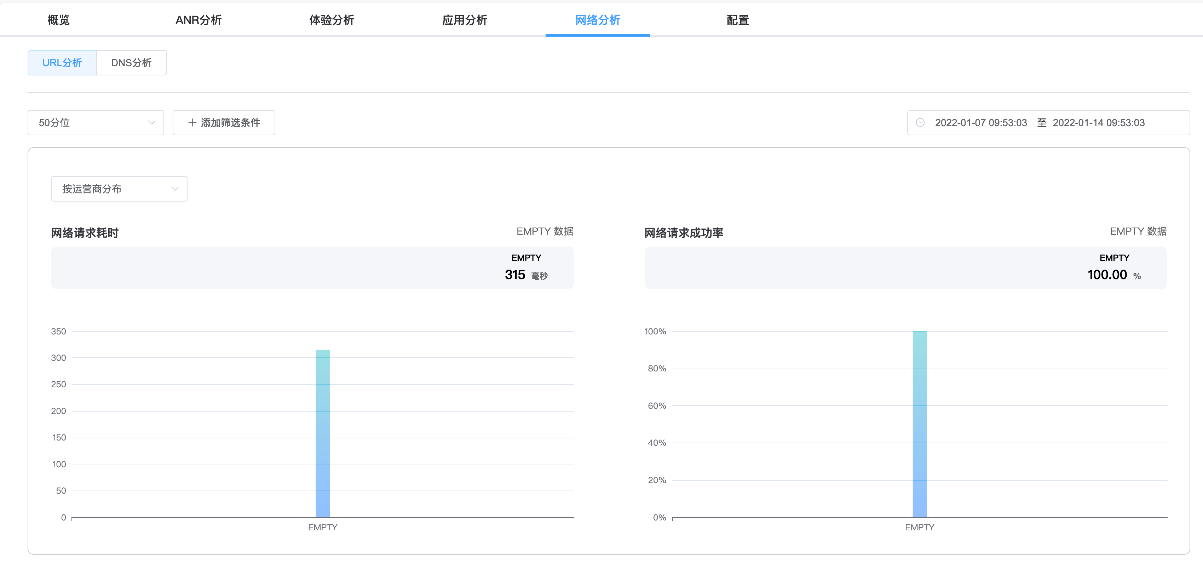
2、选择“网络分析 ",就进入了网络分析详情页面。该页面展示“网络请求耗时”和“网络请求成功率”详情。
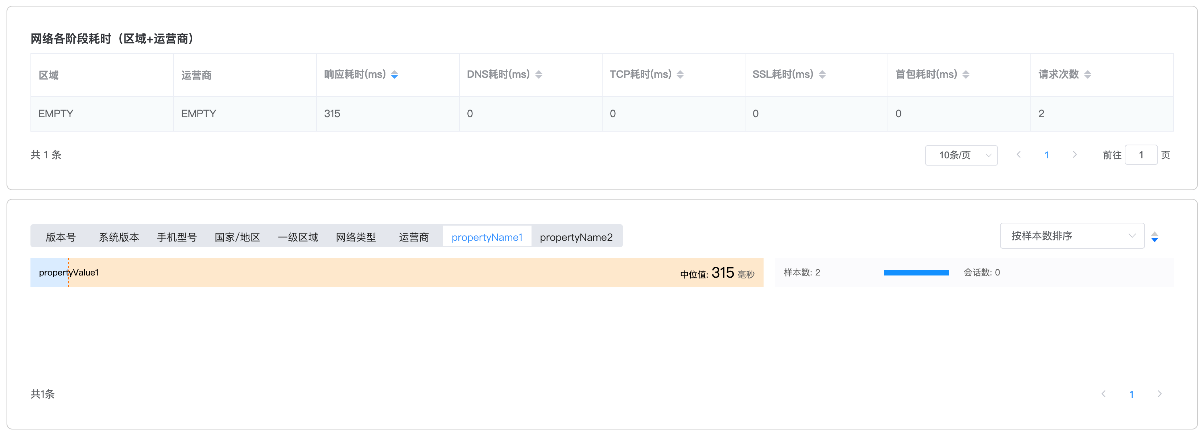
3、如果用户设定了Property,则可在“查看详情”页面中的维度栏看到对应Property下的耗时和请求成功率情况。
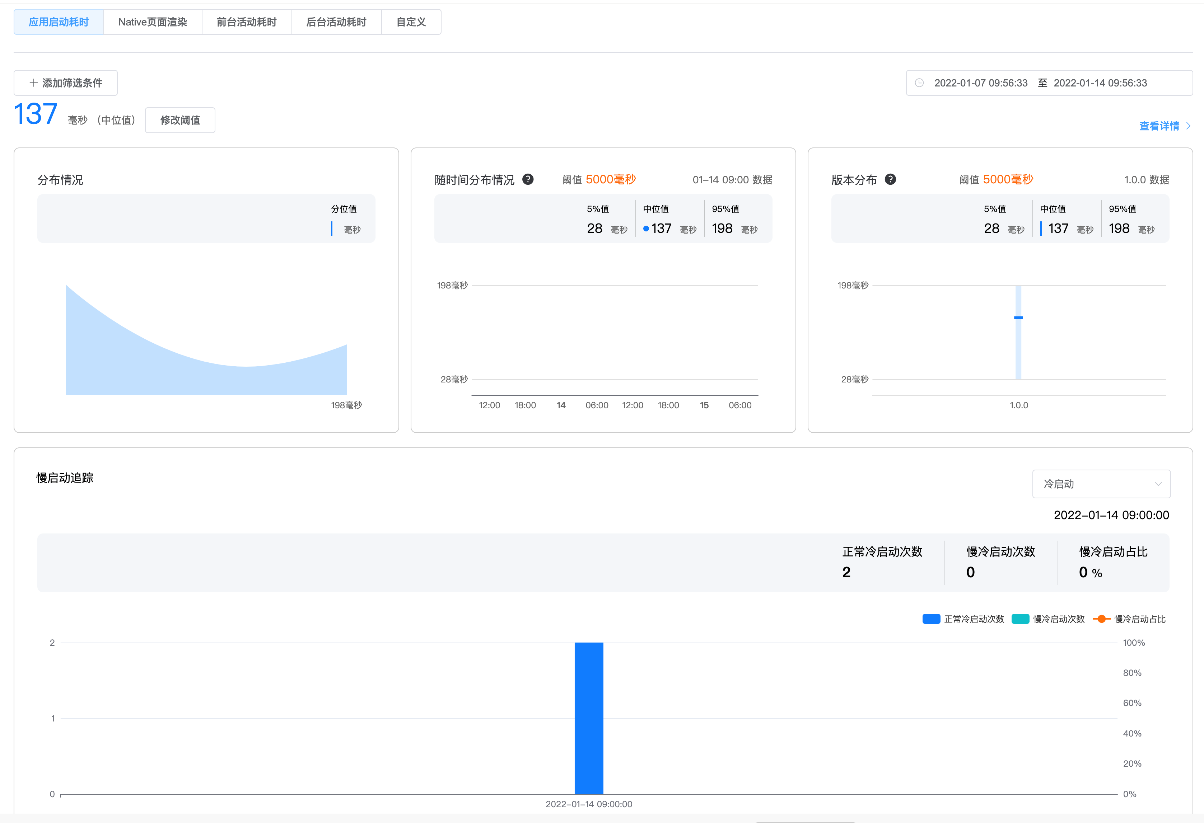
4、点击“应用分析>应用启动耗时”,可以看到应用启动时长的分布情况。
5、点击“应用分析>自定义”,该页面呈现了目前上报的自定义事件列表,包含自定义事件名称、中位值、样本数和查看详情操作。
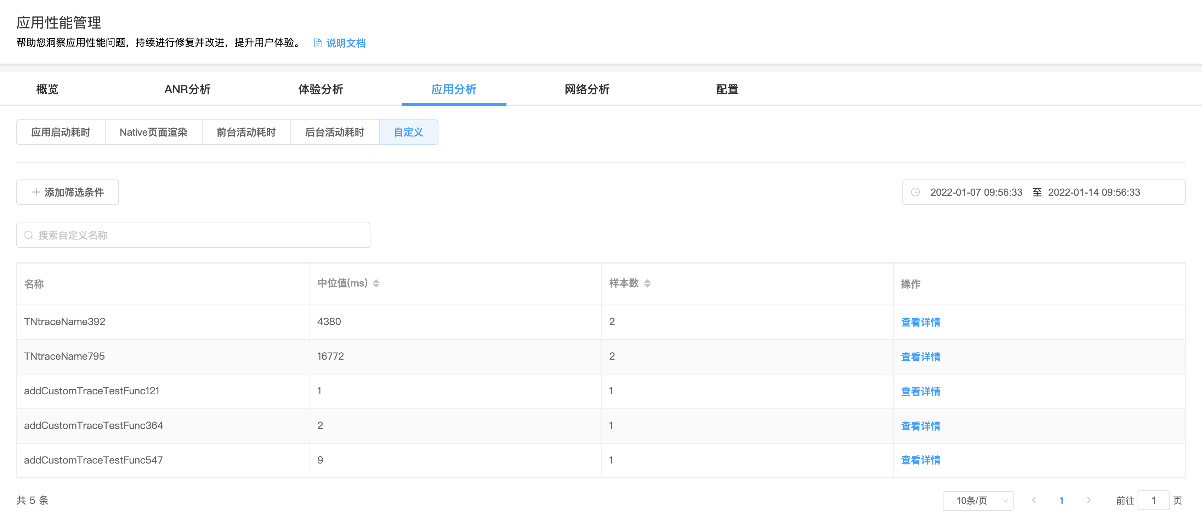
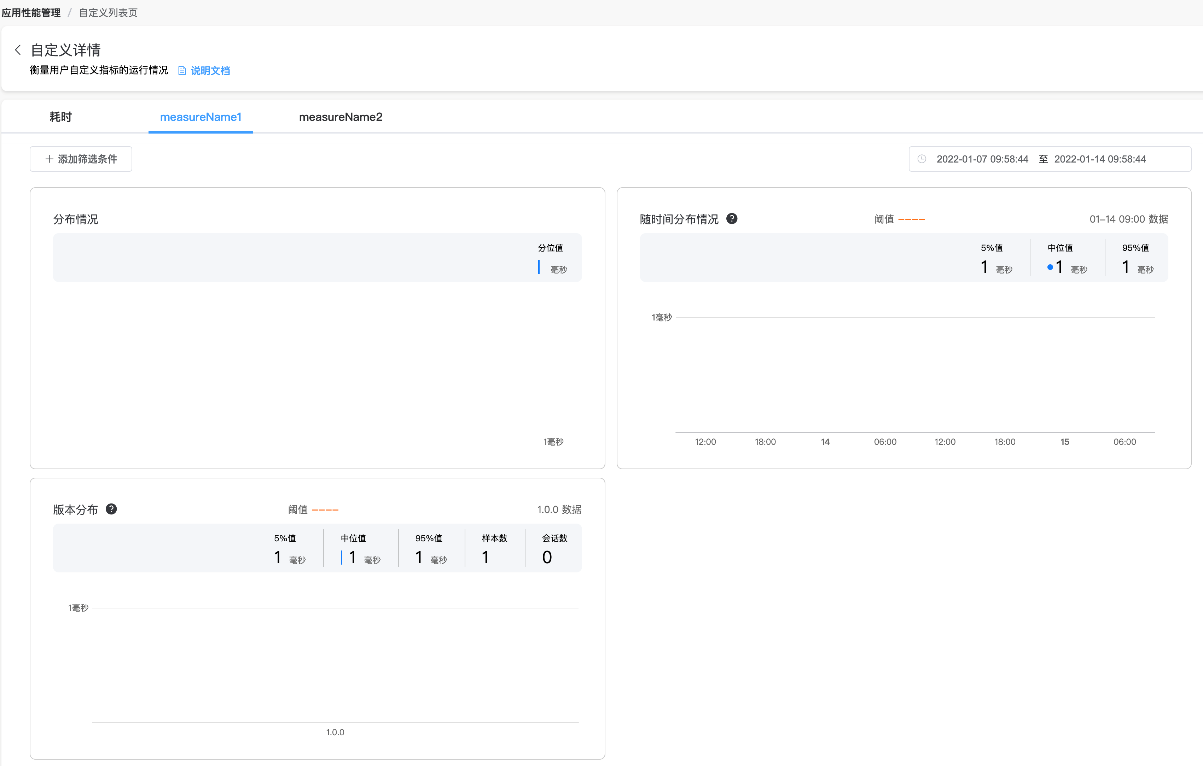
6、点击自定义事件的“查看详情"按钮,即可查看自定义事件耗时情况。
参考文档
欲了解更多更全技术文章,欢迎访问https://developer.huawei.com/consumer/cn/forum/?ha_source=zzh
标签:集成,console,success,await,alert,华为,let,error,cordova 来源: https://www.cnblogs.com/developer-huawei/p/16456955.html
本站声明: 1. iCode9 技术分享网(下文简称本站)提供的所有内容,仅供技术学习、探讨和分享; 2. 关于本站的所有留言、评论、转载及引用,纯属内容发起人的个人观点,与本站观点和立场无关; 3. 关于本站的所有言论和文字,纯属内容发起人的个人观点,与本站观点和立场无关; 4. 本站文章均是网友提供,不完全保证技术分享内容的完整性、准确性、时效性、风险性和版权归属;如您发现该文章侵犯了您的权益,可联系我们第一时间进行删除; 5. 本站为非盈利性的个人网站,所有内容不会用来进行牟利,也不会利用任何形式的广告来间接获益,纯粹是为了广大技术爱好者提供技术内容和技术思想的分享性交流网站。