标签:ol file track PostGIS cursor 数据量 GeoServer new trip
1. 引言
人类在行走或者驾驶过程中产生的GPS轨迹,是道路的一种采样,根据GPS轨迹路线,我们可以推知道路的存在,根据轨迹的密度,可以推知道路的热度以及重要性。如何才能在地图中显示大量的轨迹,这是一个值得思考的问题。诚然,可以直接加载原始轨迹数据,但是这会造成极大的网络压力。地图切片技术可以有效地解决这一问题,GIS服务器在一定比例下对地图进行切片,然后返回给客户端需要的部分,这对于地图底图(比如遥感影像)有着不错的效果
更详细的信息可参考:地图切片的原理、基于地图切片WebGIS原理及其优缺点、发布地图服务时缓存切片设置_CassyChu的博客-CSDN博客_地图切片的原理
这里,笔者使用装载PostGIS插件的PostgreSQL存储GPS轨迹矢量数据,然后使用GeoServer发布WMS地图服务,最后使用OpenLayers可视化结果
2. 环境准备
GeoServer的Windows版本安装极为简单,直接去官网GeoServer下载下来,运行start.bat脚本即可,管理员初始账户为admin,密码为geoserver
PostgreSQL+PostGIS安装可参考:PostgreSQL+PostGIS安装教程_Oruizn的博客-CSDN博客_postgresql安装postgis
- 作为实验,也可使用docker直接pull一个安装好PostgreSQL+PostGIS的镜像
- 数据库安装好后可使用数据库管理软件(如dbeaver、navicat)测试连接,并创建一个新的数据库(笔者这里创建
travel-map)
GPS数据的获取可参考:GPS地图生成03之数据获取 - 当时明月在曾照彩云归 - 博客园 (cnblogs.com)
笔者这里使用Python对数据库进行操作,Python版本为3.6(3以上即可),使用到的库有:
- ppygis3
- psycopg2
可使用pip安装:
pip install psycopg2 ppygis3
3. 数据上传至数据库
这里笔者使用的从网站获取的原始JSON数据
获取文件夹下的JSON数据文件:
import os
file = os.listdir('./trackdata/origin/')
trip_files = []
for trip_file in file:
    if trip_file.startswith('trackjson'):
        trip_files.append(trip_file)
# print(trip_files)
连接数据库,创建游标:
import psycopg2
from ppygis3 import Point, LineString, Geometry

# Connect to an existing spatially enabled database
connection = psycopg2.connect(database="travel-map", user="admin", password="root", host="127.0.0.1", port="5432")
cursor = connection.cursor()
- 注意:请修改为你的数据库配置
创建表:
cursor.execute('CREATE TABLE IF NOT EXISTS gps_track(tid INT PRIMARY KEY, geometry GEOMETRY)')
数据上载至数据库:
import json
dir = './trackdata/origin/'
for file in trip_files:
    trackjson = json.loads(open(dir+file, 'r').read())
    tmp = []
    for track in trackjson:
        tmp.append(Point(track[2],track[1],track[3]))
    geometry = LineString(tmp)
    cursor.execute('INSERT INTO gps_track VALUES(%s,%s)', (int(file[9:][:-5]),geometry))
    connection.commit()
更新空间坐标系:
cursor.execute('update gps_track set geometry = ST_SetSRID(geometry,4326)')
查询是否上传成功:
# Retrieve the table contents and print it
cursor.execute('SELECT * FROM gps_track')
for row in cursor:
    print(row[0])
关闭连接:
# Disconnect from the database
cursor.close()
connection.close()
完整代码如下:
import os
file = os.listdir('./trackdata/origin/')
trip_files = []
for trip_file in file:
    if trip_file.startswith('trackjson'):
        trip_files.append(trip_file)
# print(trip_files)
trip_files.__len__()

import psycopg2
from ppygis3 import Point, LineString, Geometry

# Connect to an existing spatially enabled database
connection = psycopg2.connect(database="travel-map", user="admin", password="root", host="127.0.0.1", port="5432")
cursor = connection.cursor()

cursor.execute('CREATE TABLE IF NOT EXISTS gps_track(tid INT PRIMARY KEY, geometry GEOMETRY)')

import json
dir = './trackdata/origin/'
for file in trip_files:
    trackjson = json.loads(open(dir+file, 'r').read())
    tmp = []
    for track in trackjson:
        tmp.append(Point(track[2],track[1],track[3]))
    geometry = LineString(tmp)
    cursor.execute('INSERT INTO gps_track VALUES(%s,%s)', (int(file[9:][:-5]),geometry))
    connection.commit()

# update gps_track  set geometry = ST_SetSRID(geometry,3857)
# DROP TABLE IF EXISTS gps_track
cursor.execute('update gps_track  set geometry = ST_SetSRID(geometry,4326)')

# Retrieve the table contents and print it
cursor.execute('SELECT * FROM gps_track')
for row in cursor:
    print(row[0])

# Disconnect from the database
cursor.close()
connection.close()
4. GeoServer连接数据库并发布服务
GeoServer的地图发布参考:
- GeoServer速成:安装启动,发布地图,加载QGIS - 知乎 (zhihu.com)
- GeoServer在Linux上源码安装、启动、发布地图服务 - 当时明月在曾照彩云归 - 博客园 (cnblogs.com)
这里笔者直接添加数据源:
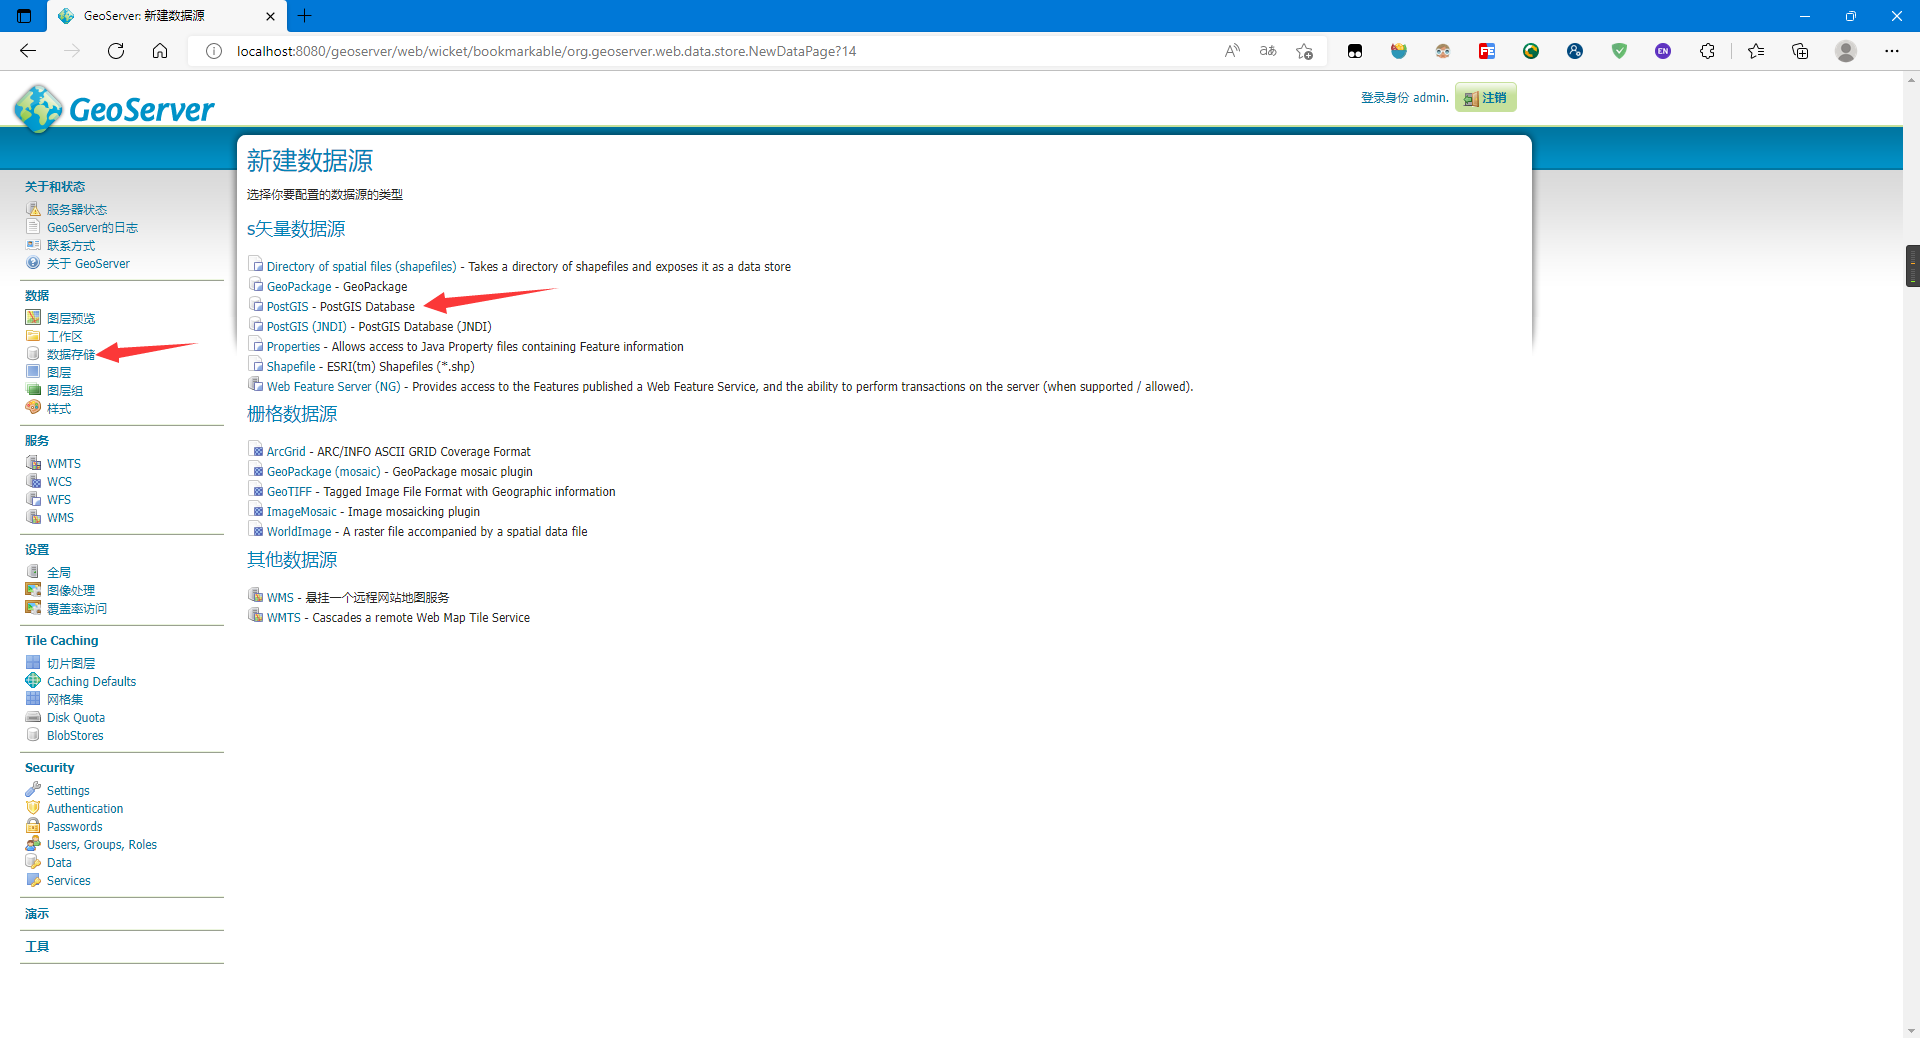
设置好参数,尤其是连接参数:
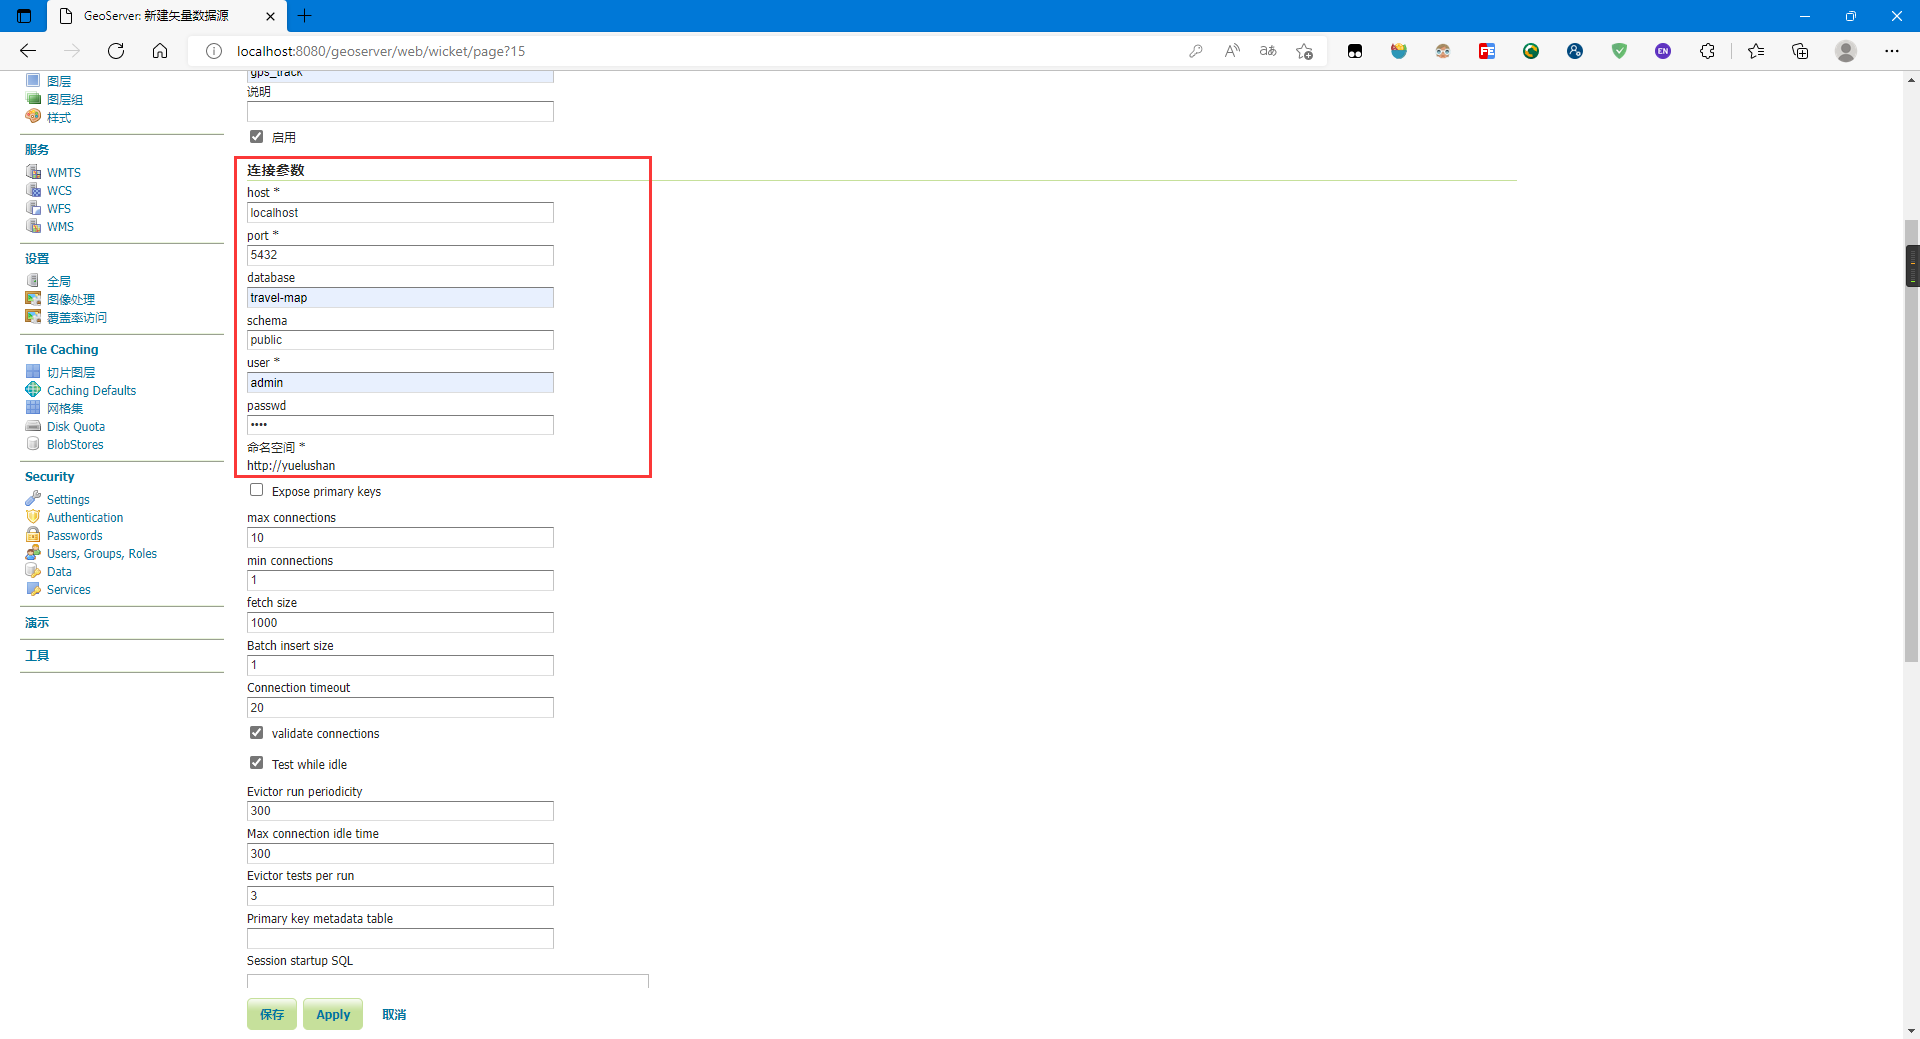
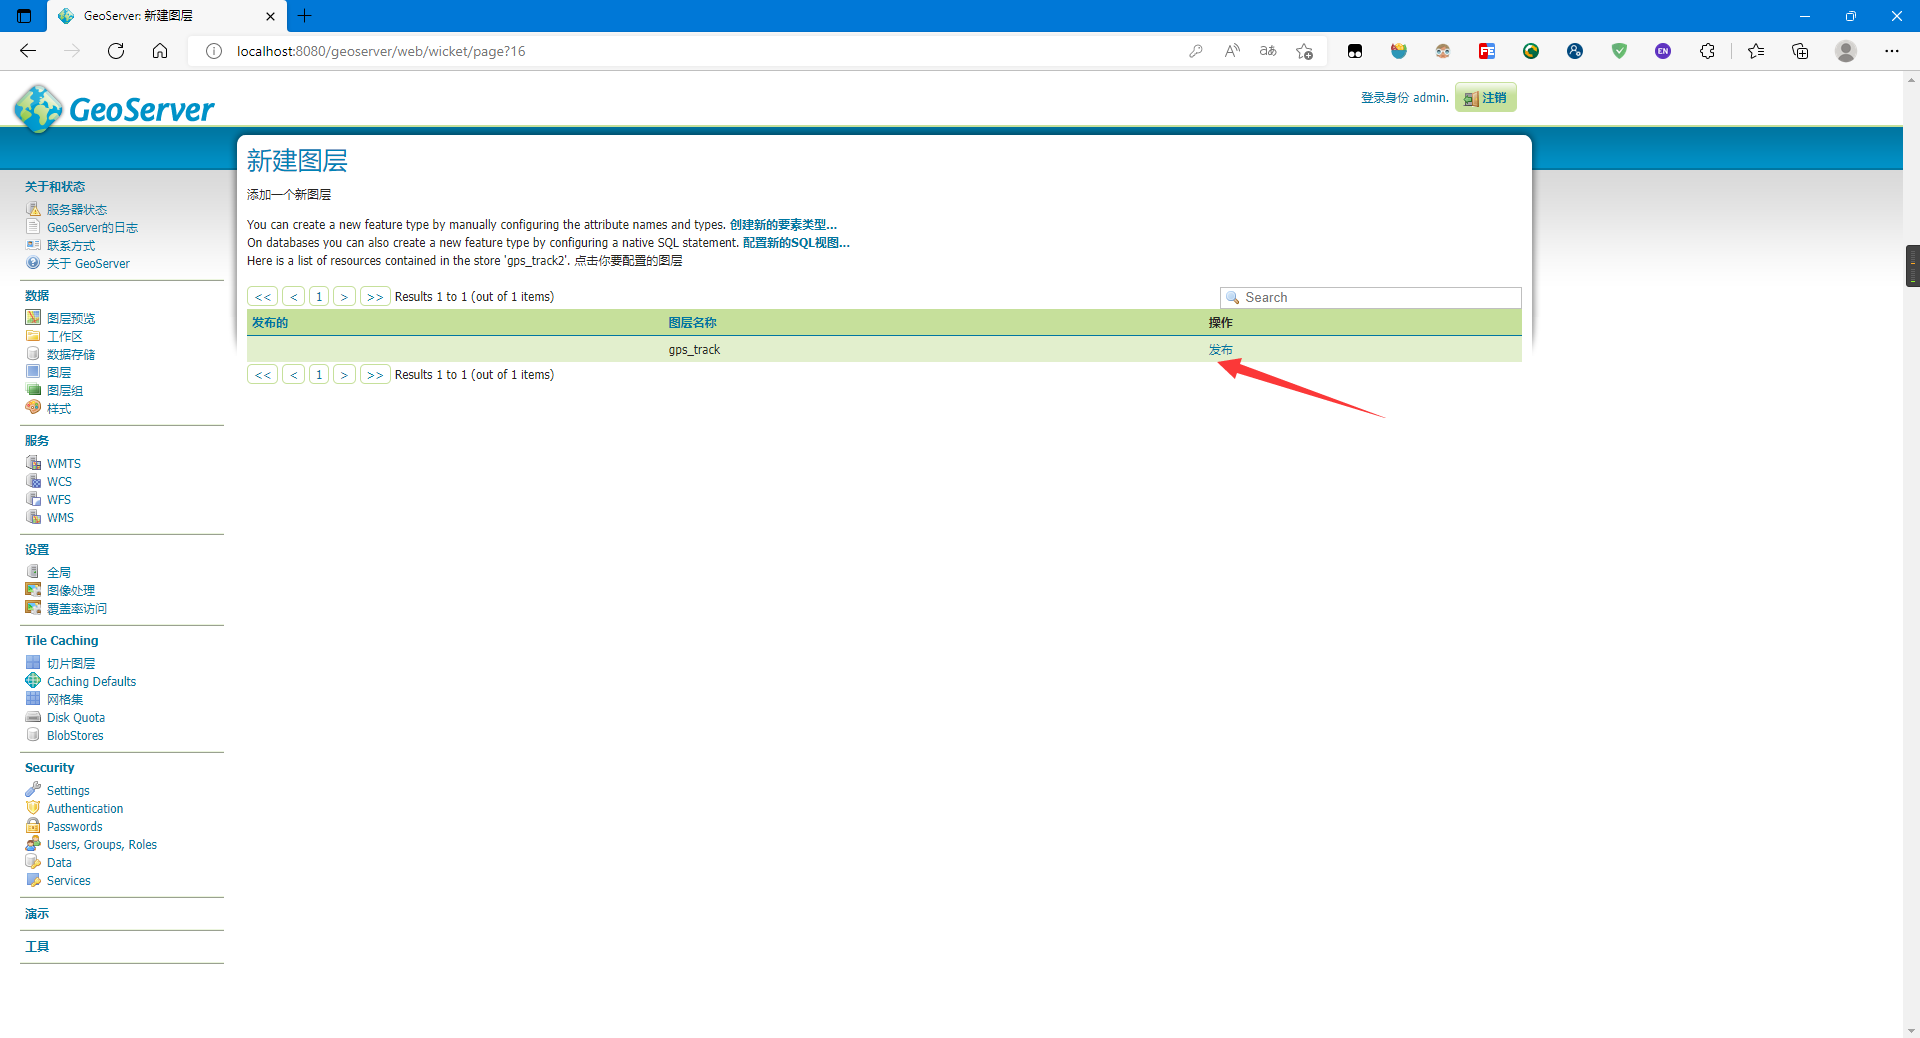
顺利的话点击保存进入发布界面:
设置发布地图的参数,主要是坐标系与范围:
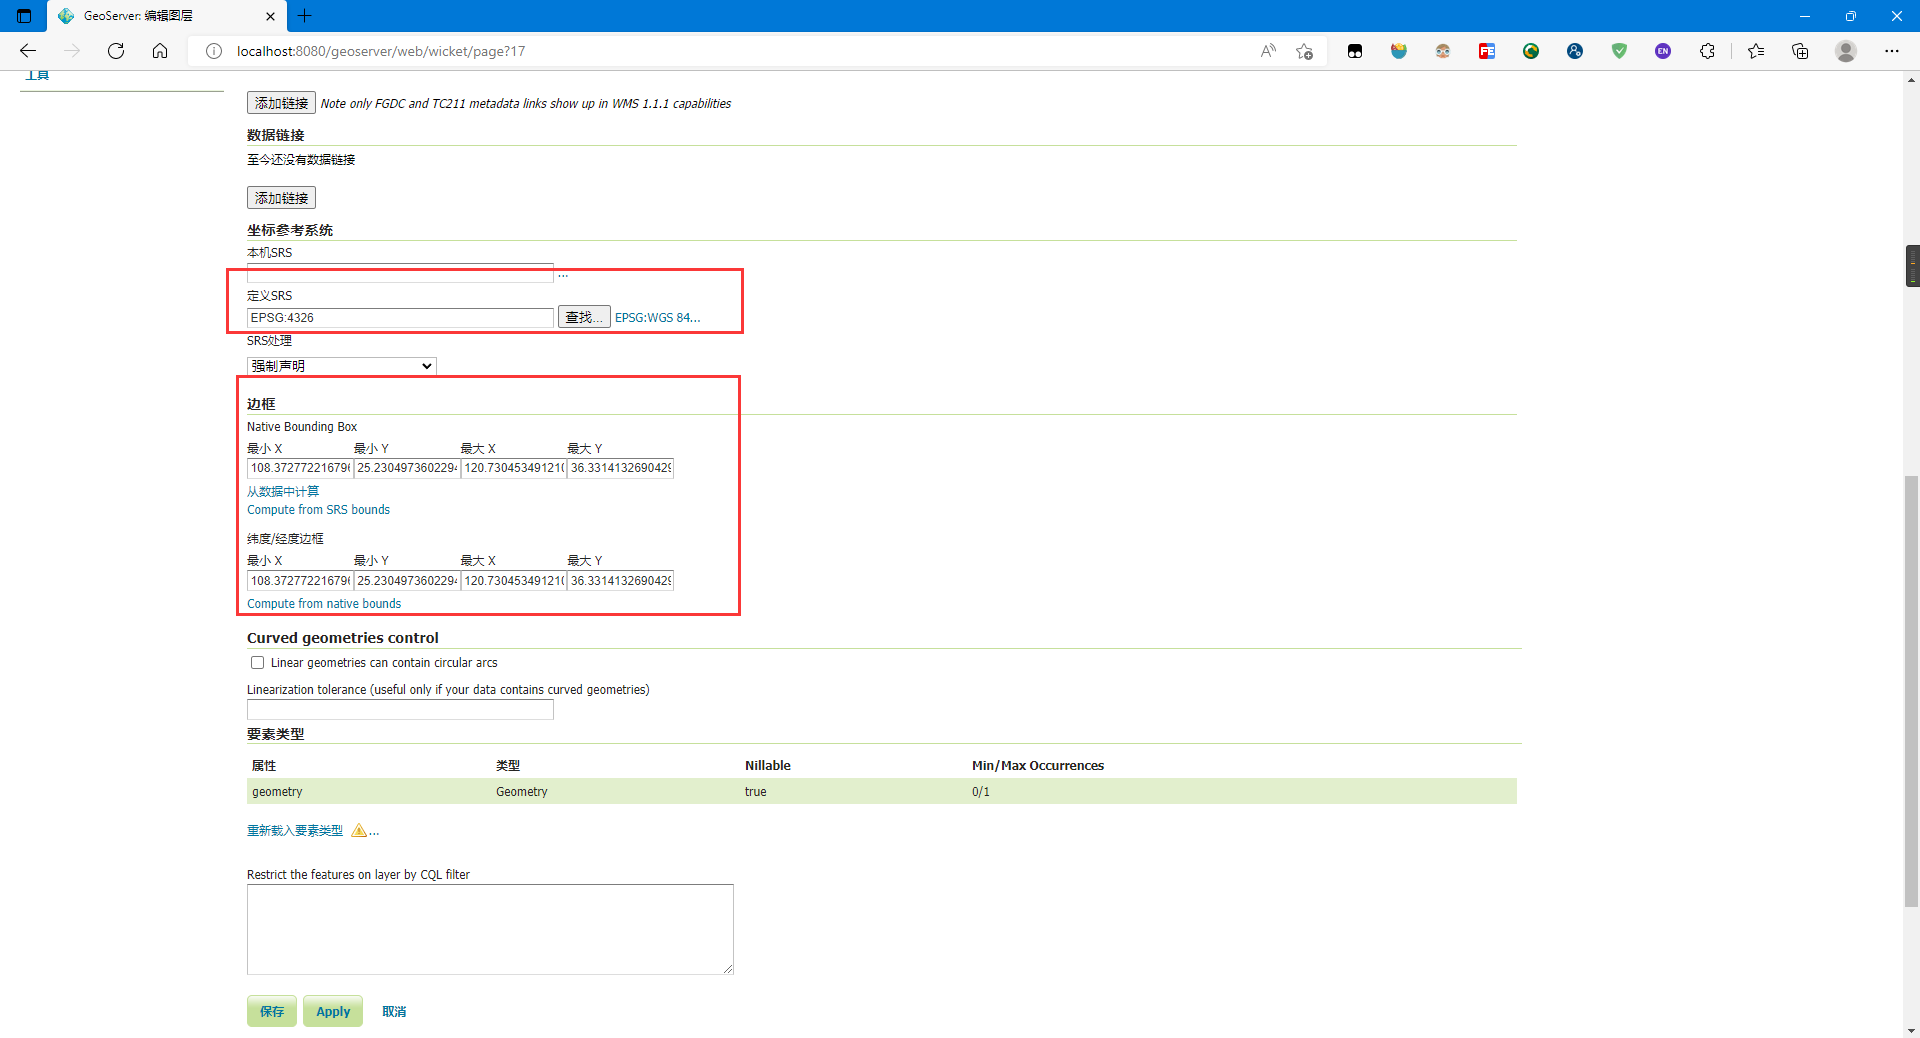
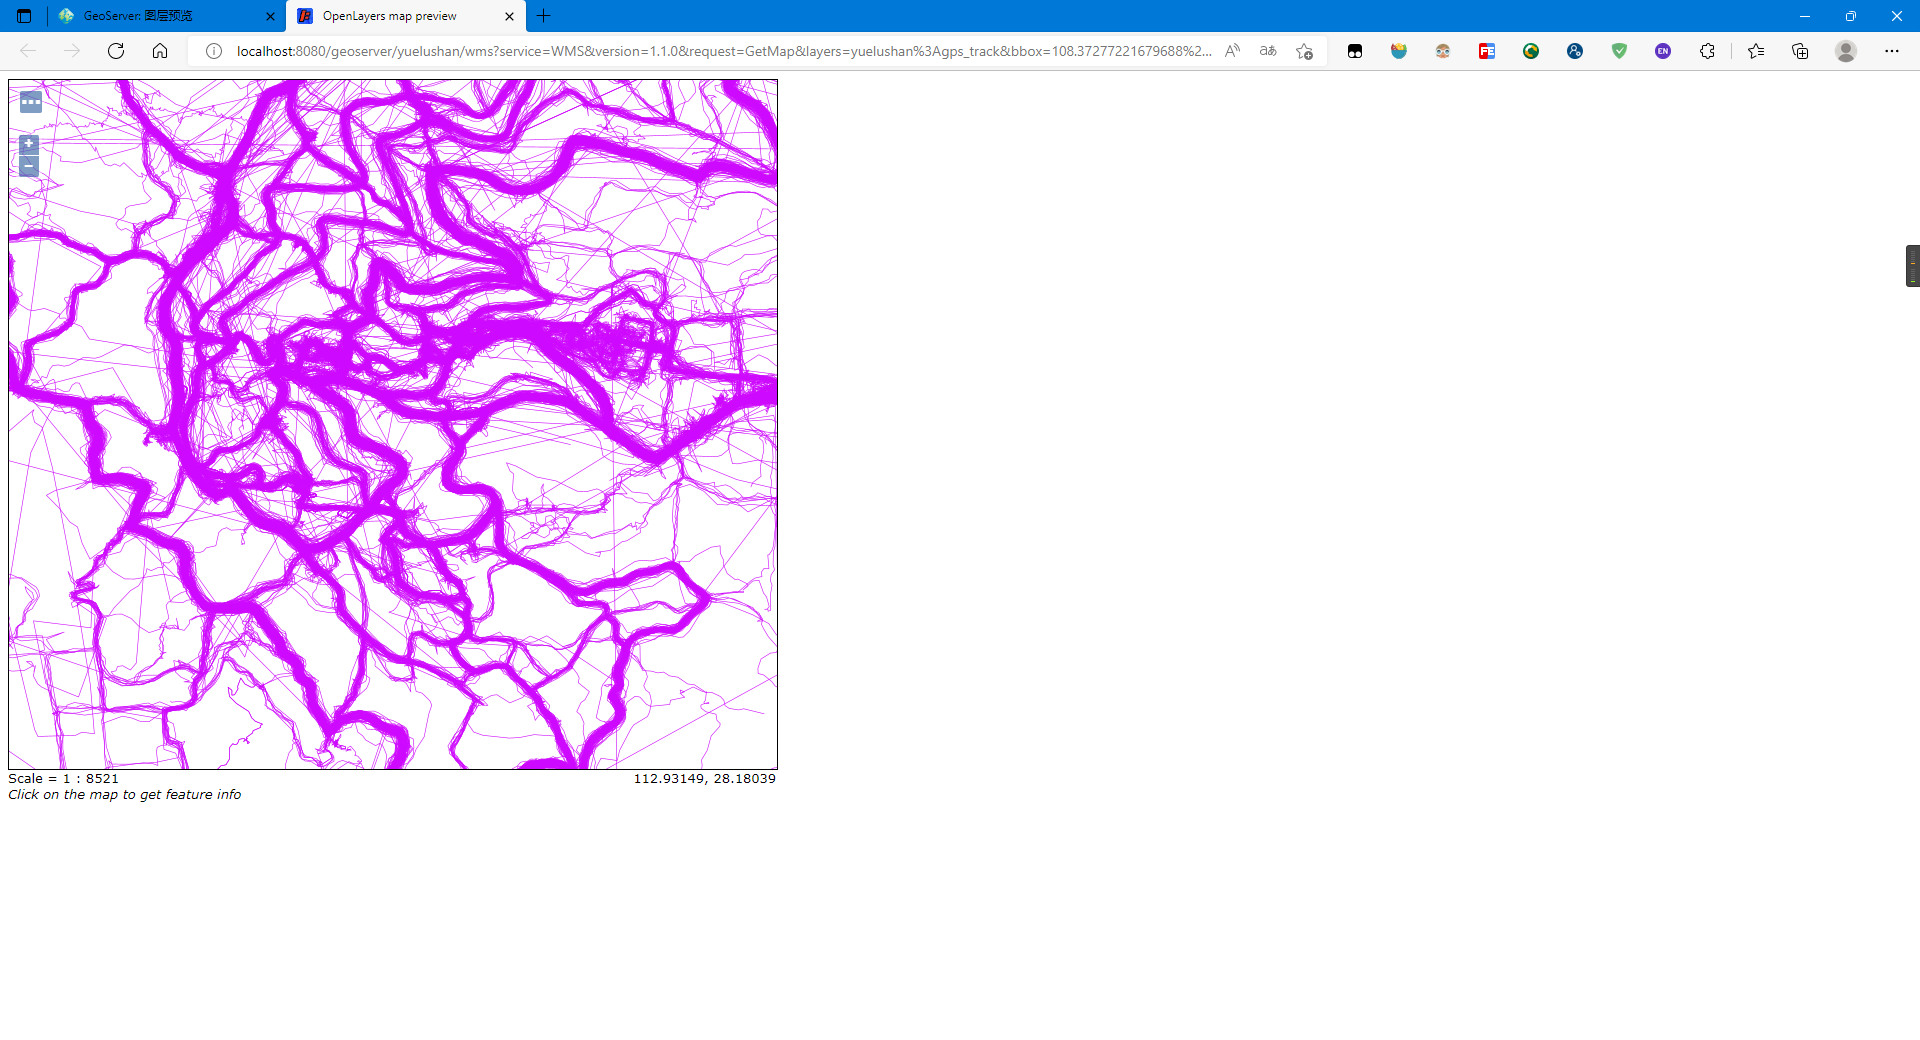
点击保存,可点击图层预览预览刚才上传的数据:
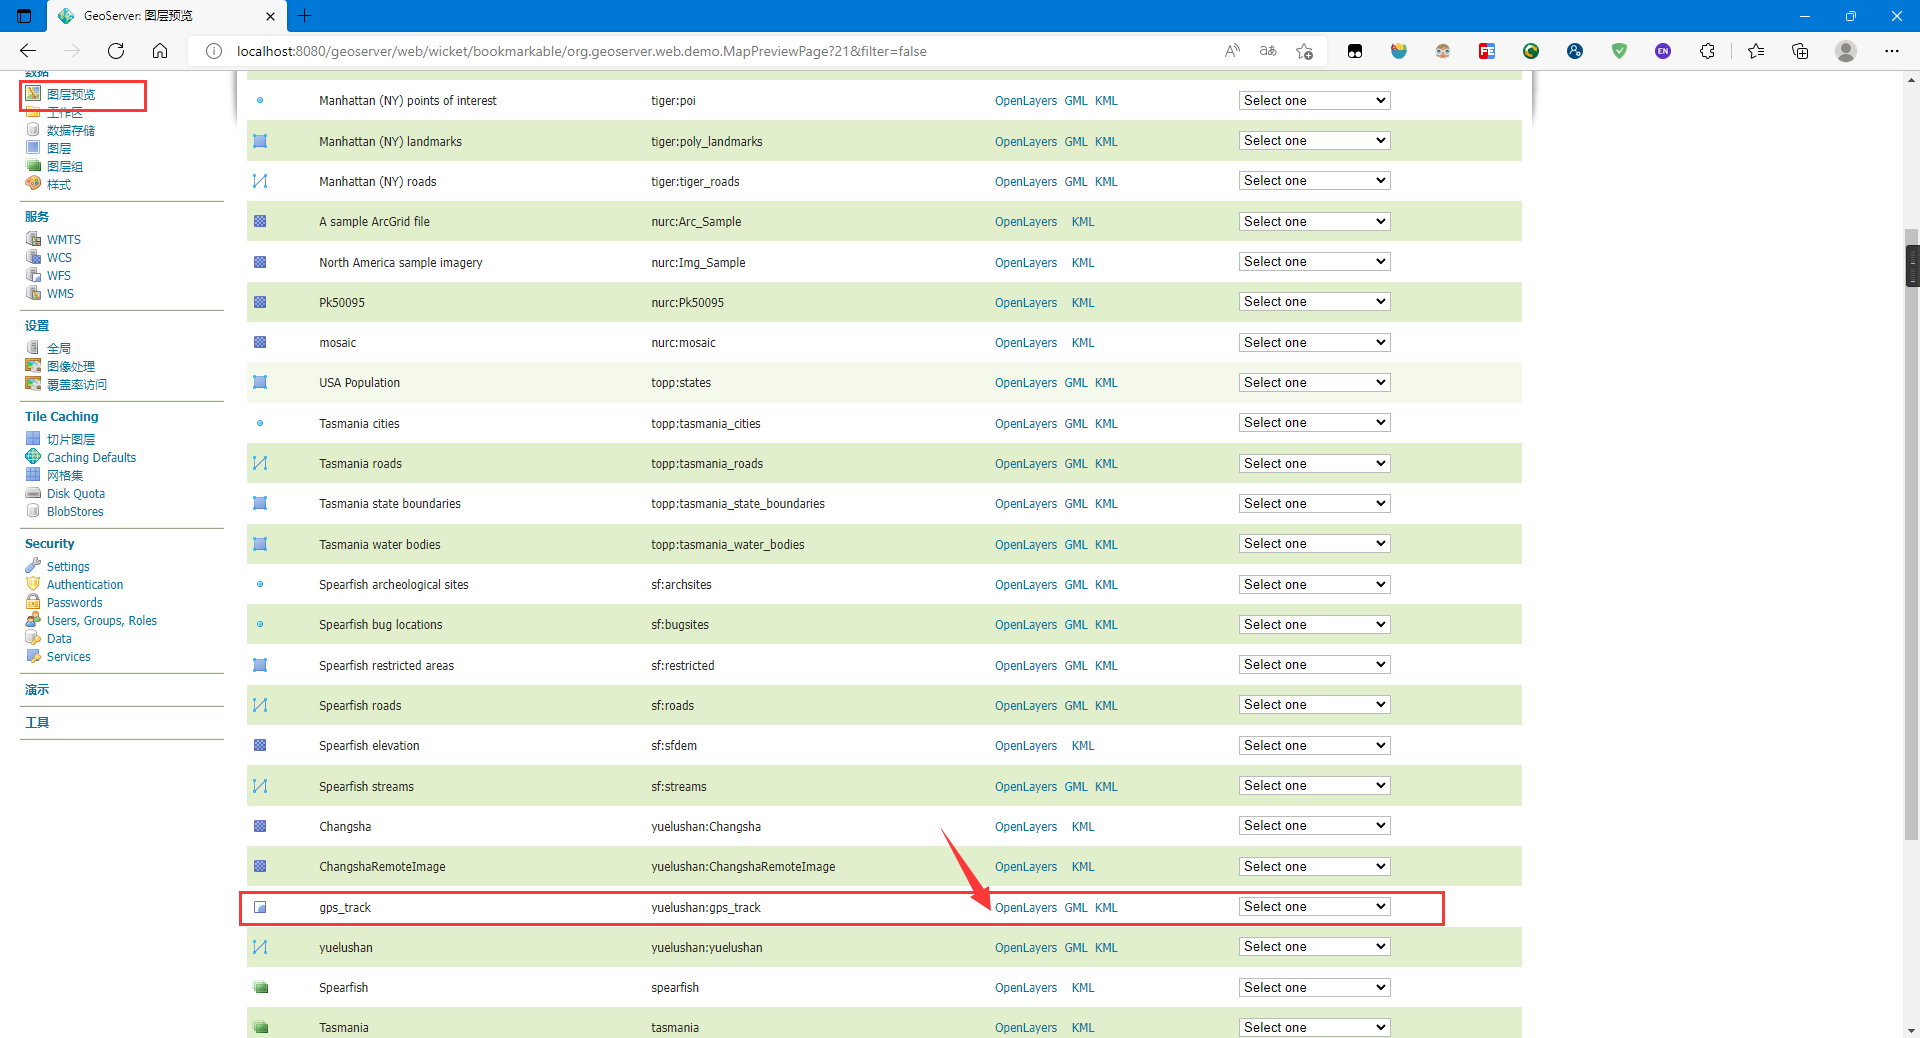
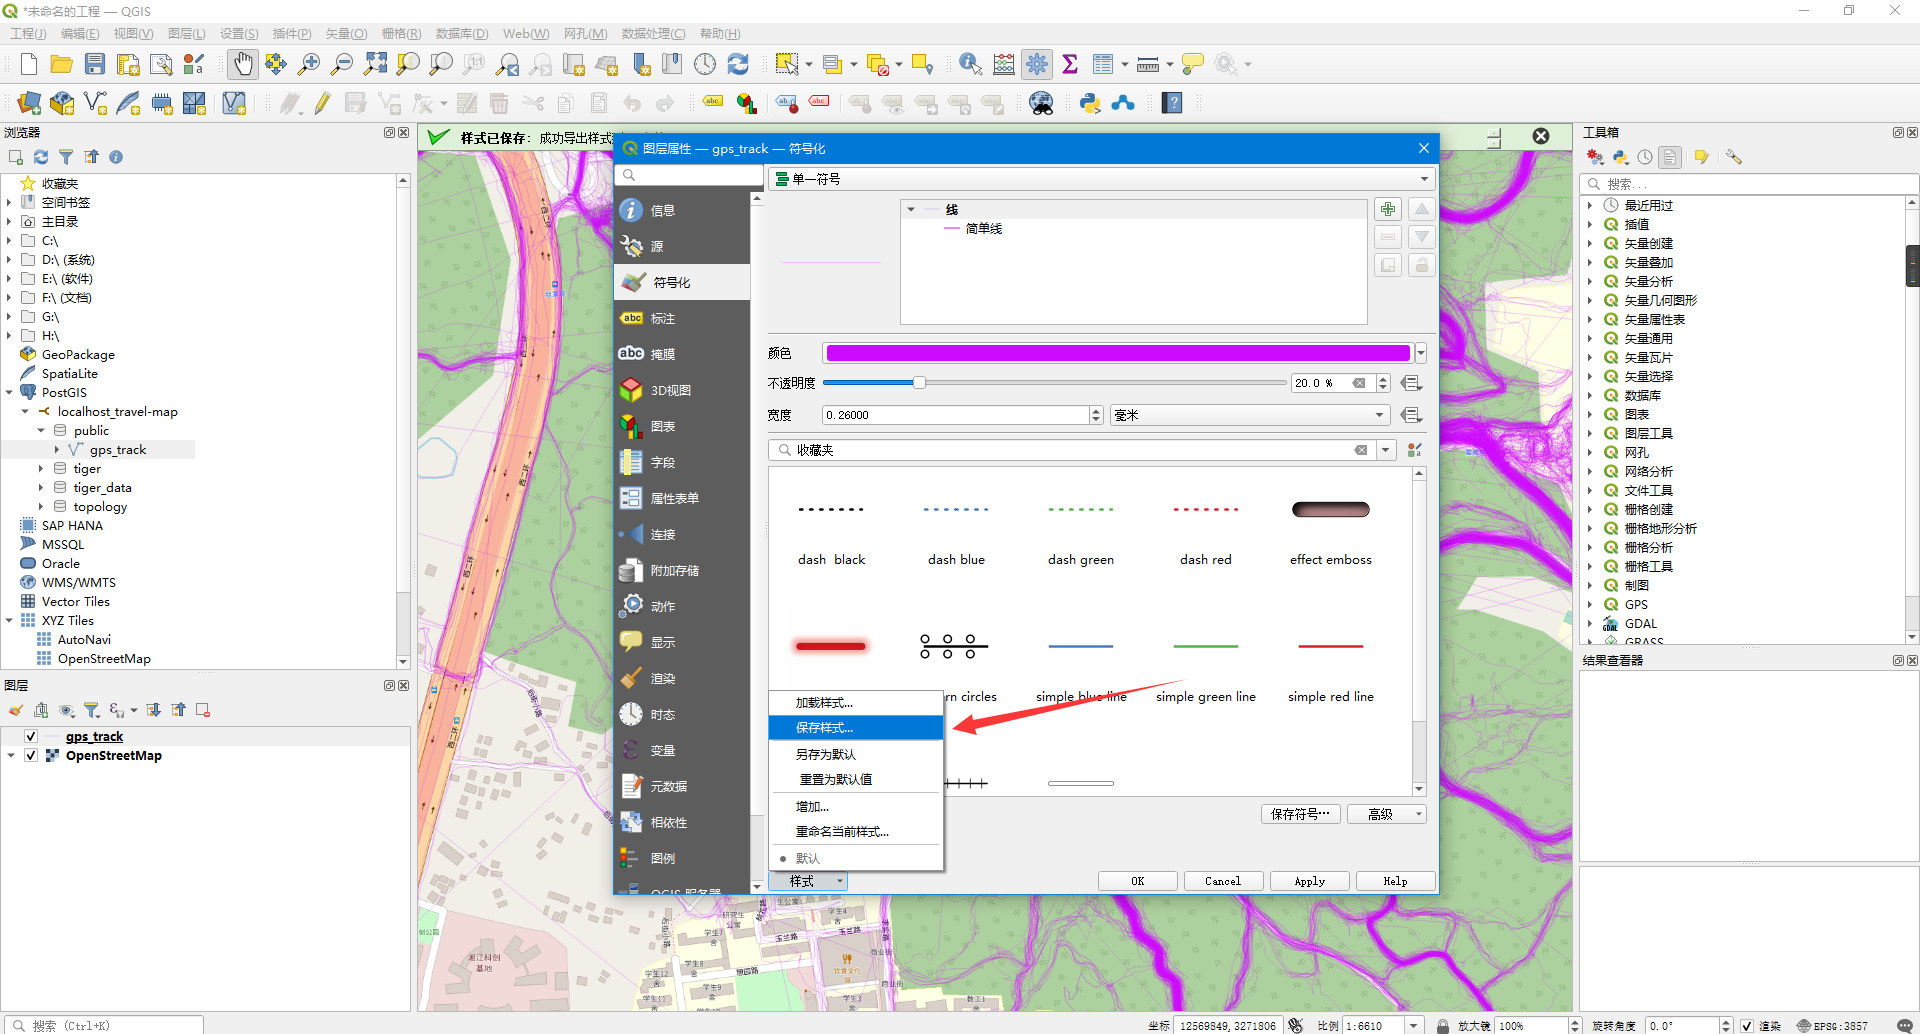
以下是设置地图样式的步骤
这里笔者使用QGIS设置样式并导出SLD样式:
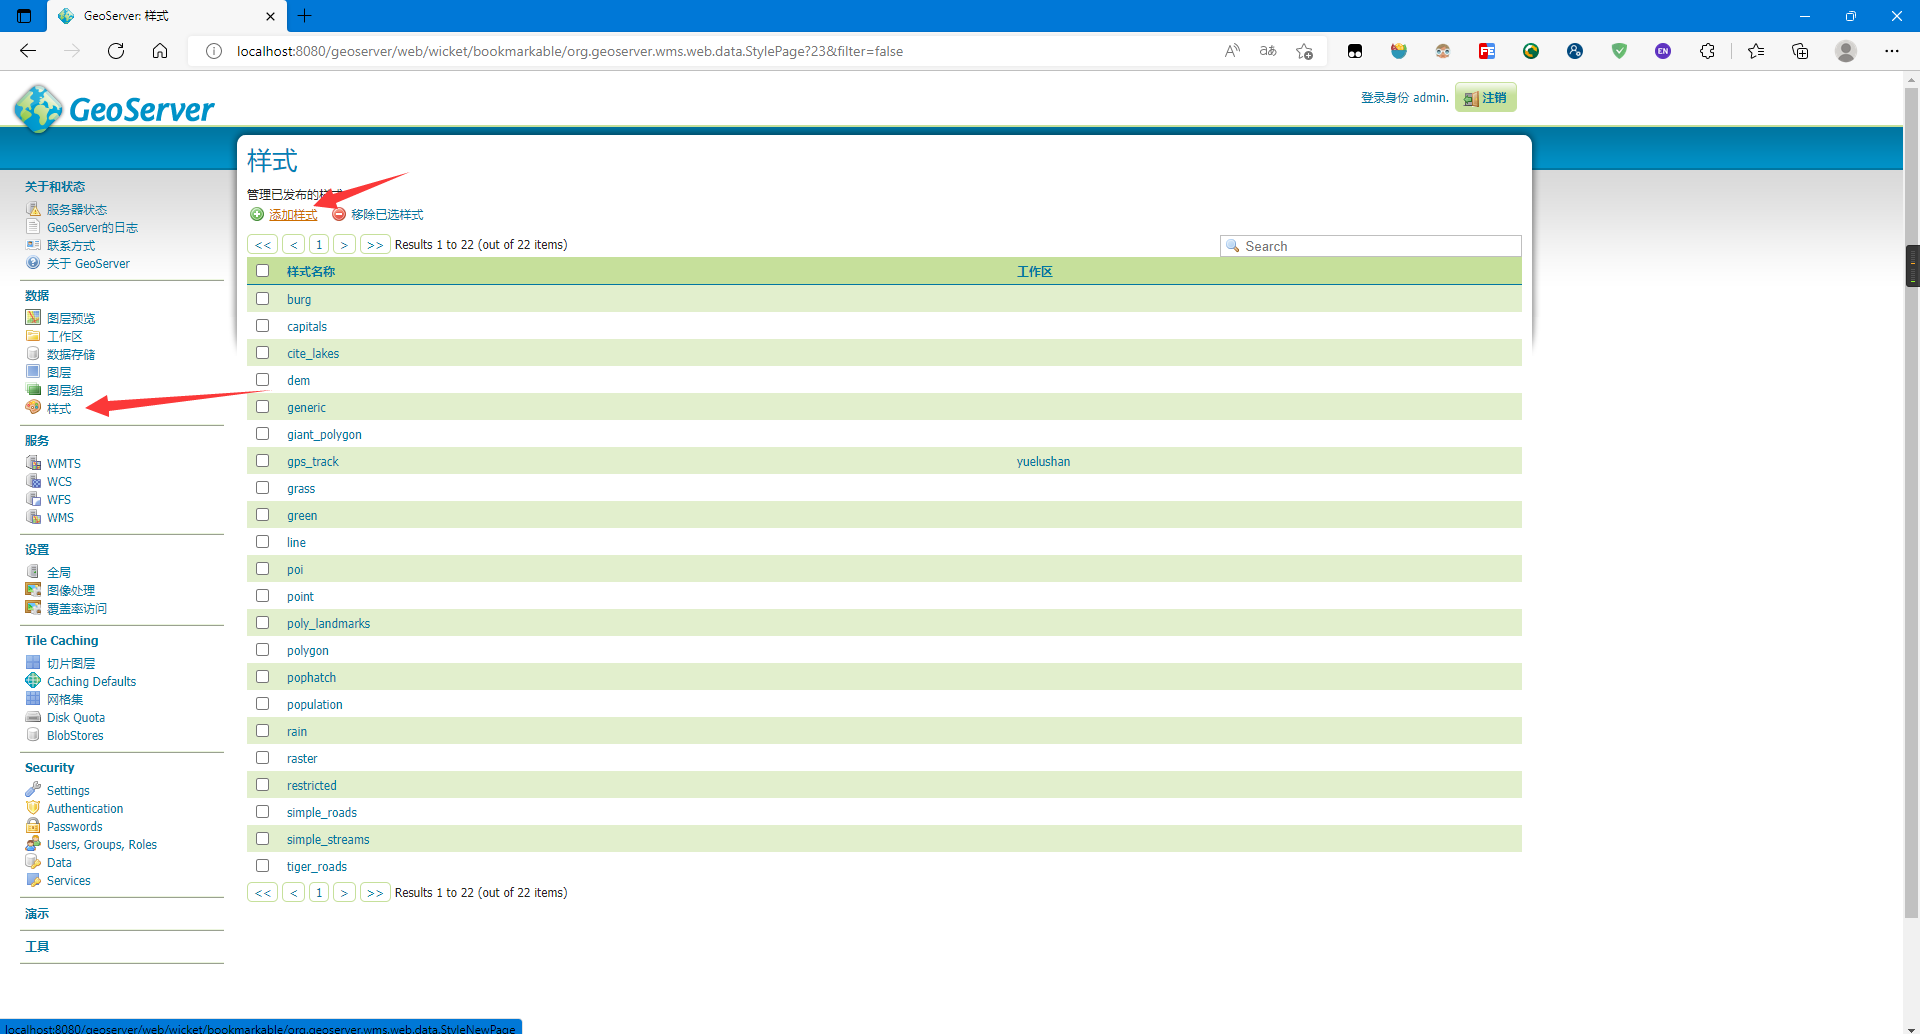
点击样式,添加样式:
设置参数,上传SLD文件,并点击upload:
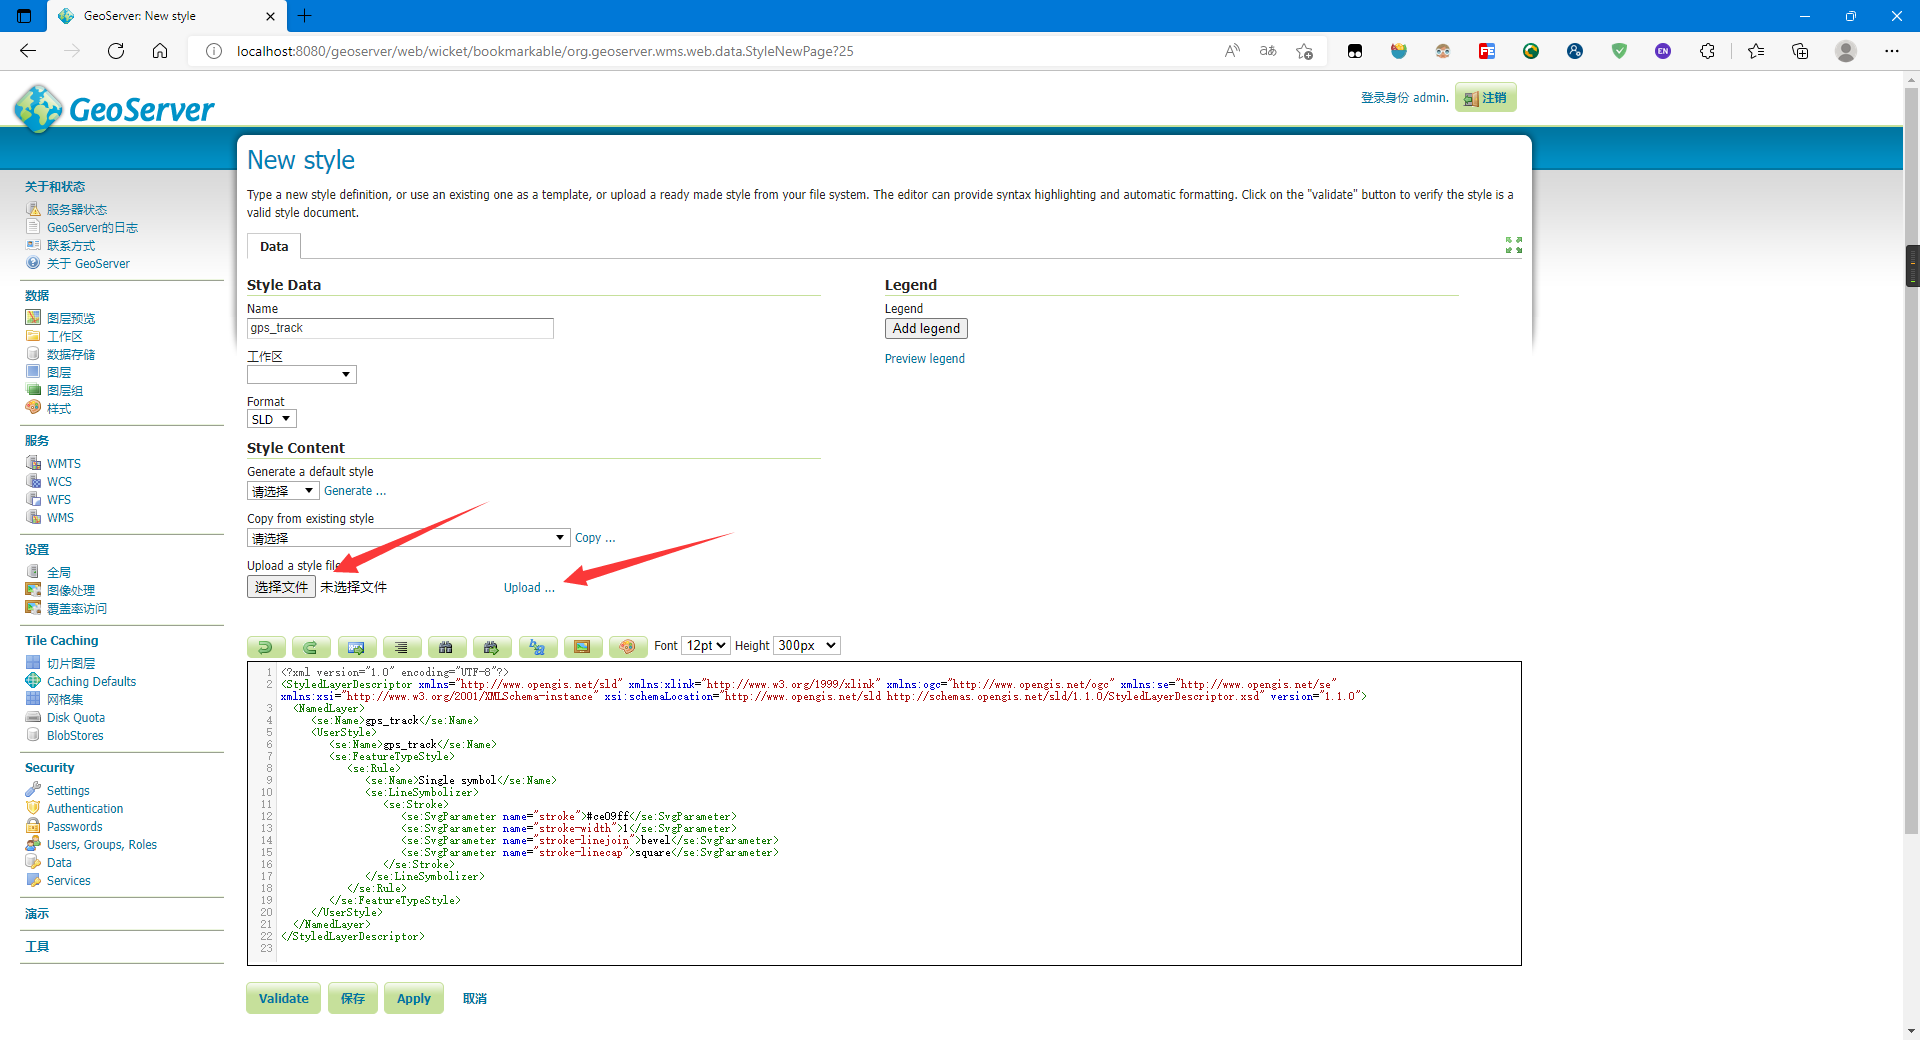
- upload后文本框内会出现相应的文本代码
点击验证与保存
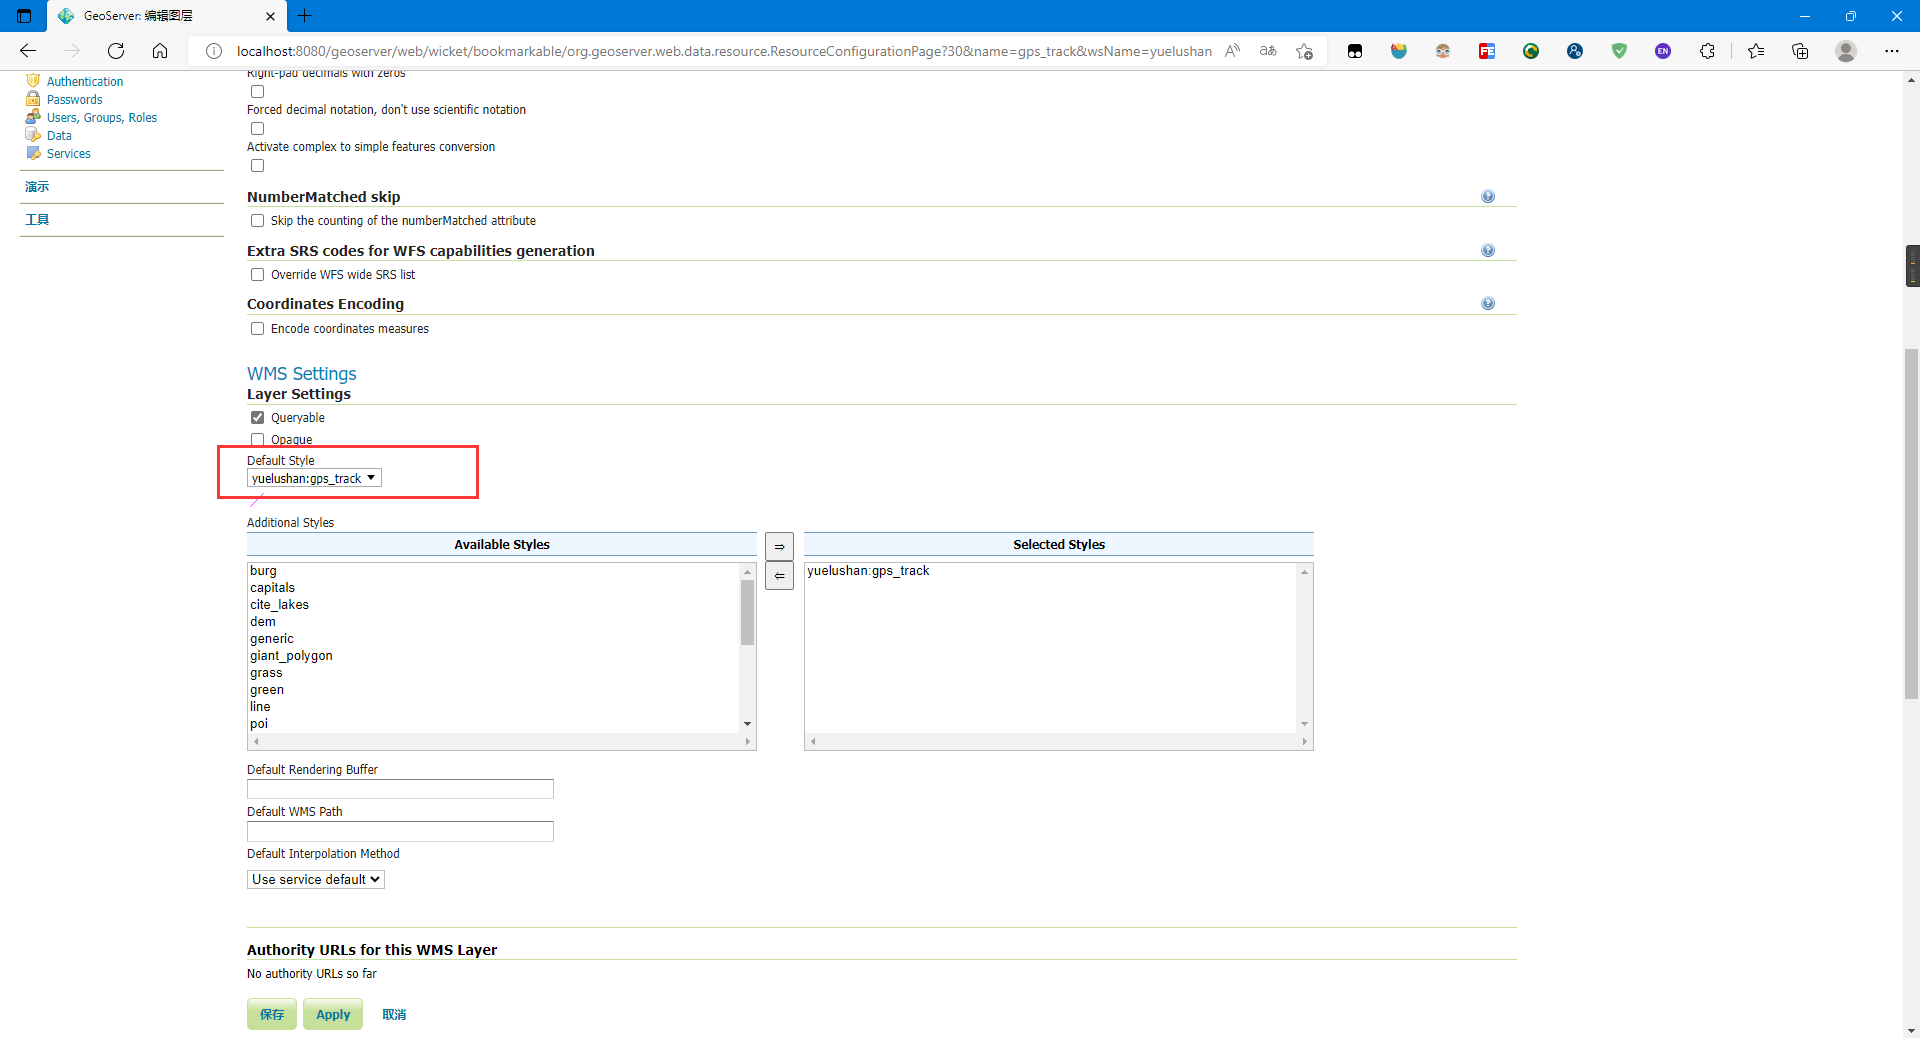
点击图层选择你的图层并点击发布设置样式:
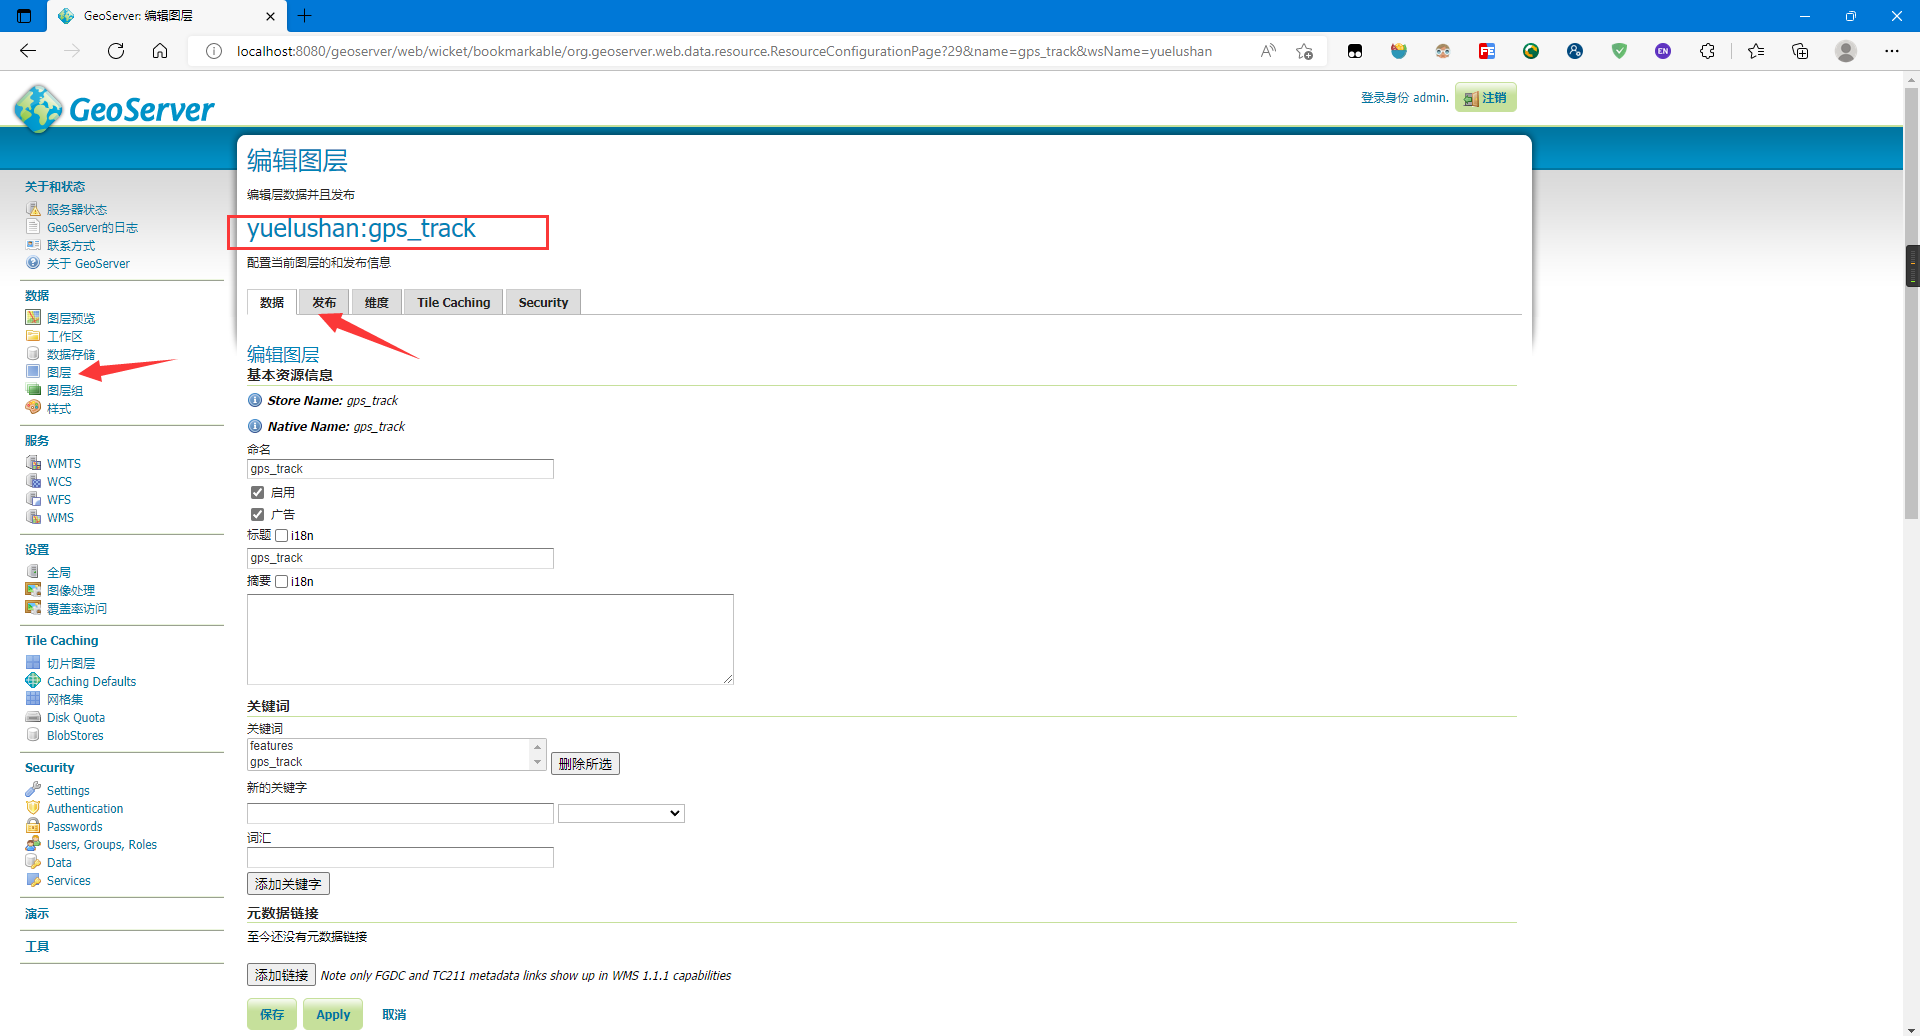
设置你创建的样式为默认样式并保存:
再次预览,可以发现样式已经更改:
5. 使用OpenLayers调用地图服务
其实刚才的预览就已经是使用OpenLayers调用地图服务
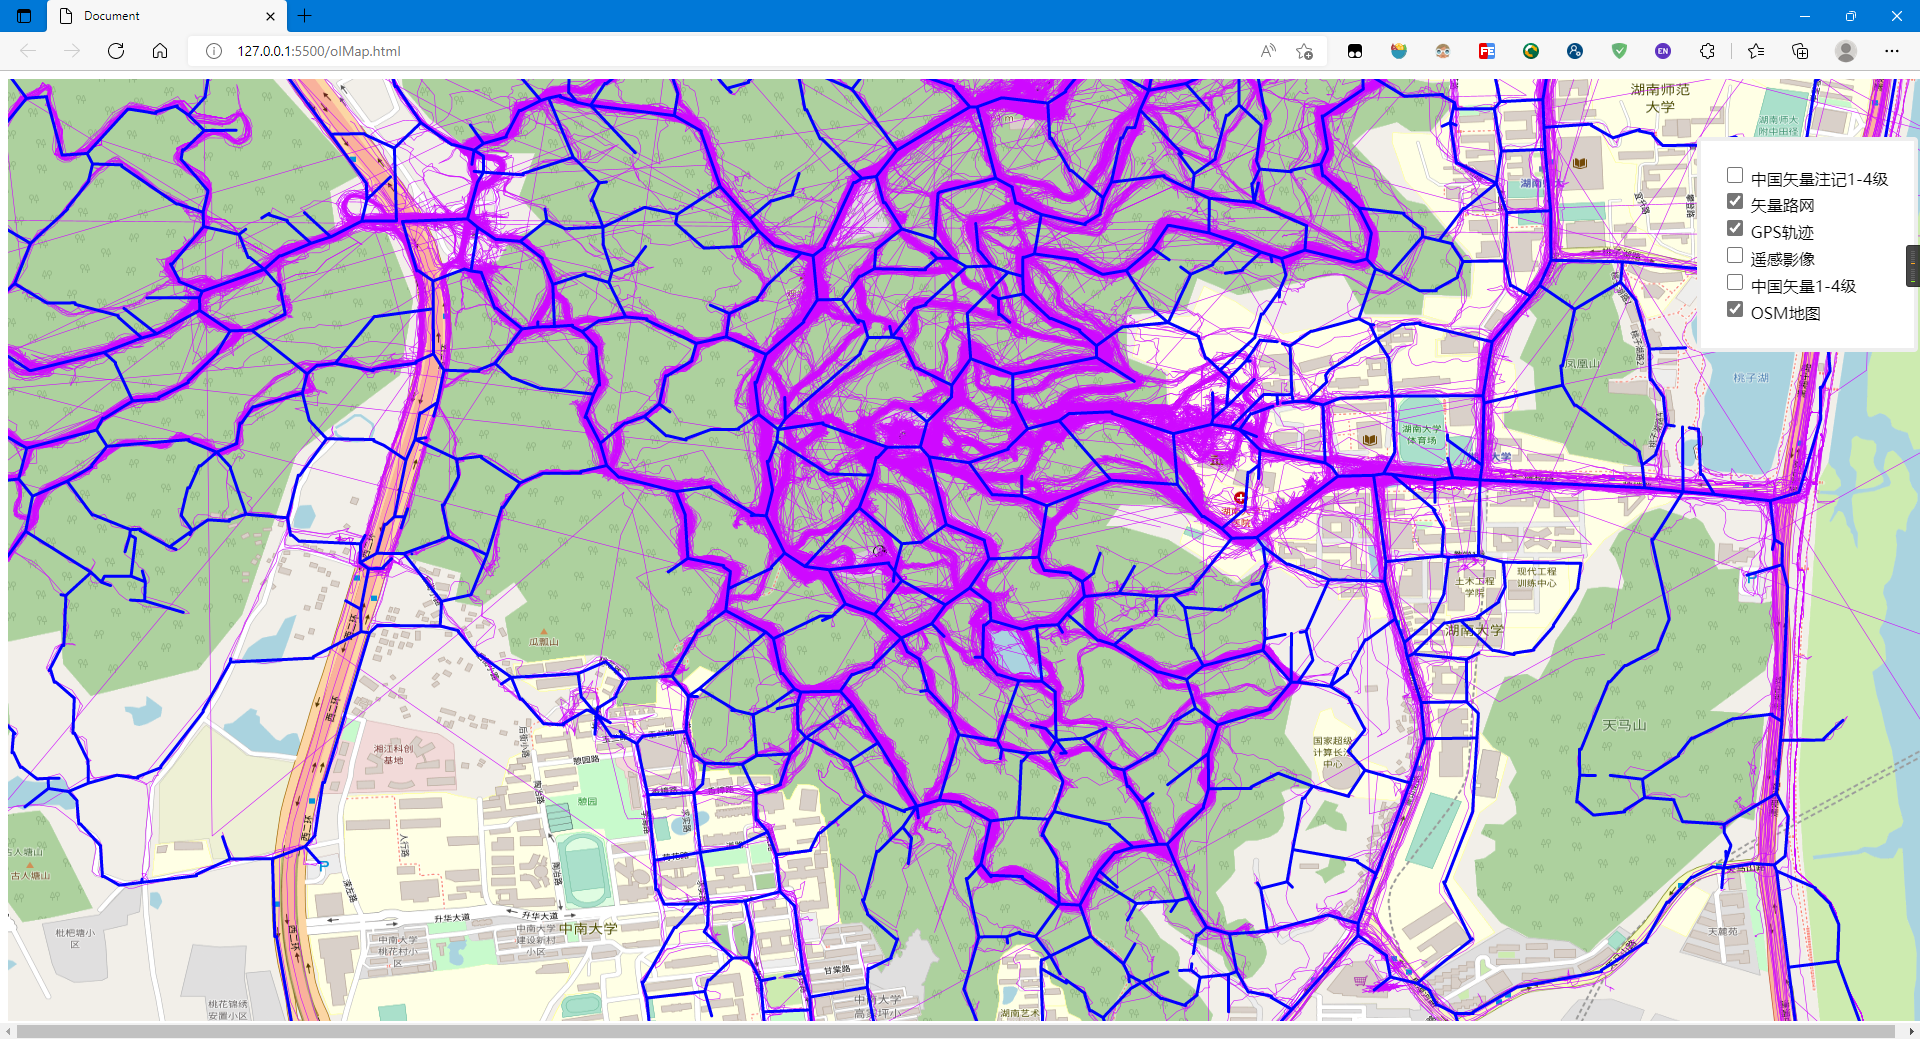
这里笔者主要是使用OpenLayer的图层控制插件ol-layerswitcher: walkermatt/ol-layerswitcher: Layer control for OpenLayers (github.com) 来加载与控制影像地图、轨迹地图与矢量路网等
加载OpenLayer与ol-layerswitcher的CDN:
<script src="https://cdnjs.cloudflare.com/ajax/libs/openlayers/4.6.5/ol.js"></script>
<script src="https://unpkg.com/ol-layerswitcher@3.8.3"></script>
<link rel="stylesheet" href="https://unpkg.com/ol-layerswitcher@3.8.3/dist/ol-layerswitcher.css" />
<link rel="stylesheet" href="https://cdnjs.cloudflare.com/ajax/libs/openlayers/4.6.5/ol.css">
加载GPS轨迹地图:
new ol.layer.Tile({
    title: 'GPS轨迹',
    source: new ol.source.TileWMS({
        url: 'http://localhost:8080/geoserver/yuelushan/wms',
        params: { 'LAYERS': 'yuelushan:gps_track' }
    })
}),
添加图层控制控件:
const layerSwitcher = new LayerSwitcher({
                reverse: true,
                groupSelectStyle: 'group'
            });
            olMap.addControl(layerSwitcher);
- 图层名为加载图层时的title
完整代码如下:
<!DOCTYPE html>
<html lang="zh">

<head>
    <meta charset="UTF-8">
    <meta http-equiv="X-UA-Compatible" content="IE=edge">
    <meta name="viewport" content="width=device-width, initial-scale=1.0">
    <title>Document</title>
    <script src="https://cdnjs.cloudflare.com/ajax/libs/openlayers/4.6.5/ol.js"></script>
    <script src="https://unpkg.com/ol-layerswitcher@3.8.3"></script>
    <link rel="stylesheet" href="https://unpkg.com/ol-layerswitcher@3.8.3/dist/ol-layerswitcher.css" />
    <link rel="stylesheet" href="https://cdnjs.cloudflare.com/ajax/libs/openlayers/4.6.5/ol.css">
    <style>
        #olmap {
            width:
                100%;
            height: 99%;
            position: absolute;
        }

        #menu {
            position: absolute;
            top: 30px;
            left: 20px;
            z-index: 11;
        }
    </style>
</head>

<body>

    <body>
        <div id="olmap"></div>
        <script type="text/javascript">
            var projection = ol.proj.get("EPSG:4326"); var projectionExtent = projection.getExtent();
            var size = ol.extent.getWidth(projectionExtent) / 256; var resolutions = [];
            for (var z = 2; z < 19; ++z) {
                resolutions[z] = size / Math.pow(2, z);
            }
            var vectorSource = new ol.source.Vector({
                url: "./final_map.json",
                format: new ol.format.GeoJSON()
            })
            var olMap = new ol.Map({
                target: "olmap",
                layers: [
                    new ol.layer.Tile({
                        title: "OSM地图",
                        source: new ol.source.XYZ({
                            url: 'http://{a-c}.tile.openstreetmap.org/{z}/{x}/{y}.png'
                        })
                    }),
                    new ol.layer.Tile({
                        title: "中国矢量1-4级",
                        source: new ol.source.WMTS({
                            url: "http://t{0-6}.tianditu.gov.cn/vec_c/wmts?tk=1d109683f4d84198e37a38c442d68311",
                            name: "中国矢量1-4级",
                            layer: "vec",
                            style: "default",
                            matrixSet: "c",
                            format: "tiles",
                            wrapX: true,
                            tileGrid: new ol.tilegrid.WMTS({
                                origin: ol.extent.getTopLeft(projectionExtent),
                                resolutions: resolutions,
                                matrixIds: [0, 1, 2, 3, 4, 5, 6, 7, 8, 9, 10, 11, 12, 13, 14]
                            })
                        }),
                    }),
                    new ol.layer.Tile({
                        title: '遥感影像',
                        source: new ol.source.BingMaps({
                            key: "ApTJzdkyN1DdFKkRAE6QIDtzihNaf6IWJsT-nQ_2eMoO4PN__0Tzhl2-WgJtXFSp",
                            imagerySet: 'Aerial',
                        }),
                    }),
                    new ol.layer.Tile({
                        title: 'GPS轨迹',
                        source: new ol.source.TileWMS({
                            url: 'http://localhost:8080/geoserver/yuelushan/wms',
                            params: { 'LAYERS': 'yuelushan:gps_track' }
                        })
                    }),
                    new ol.layer.Vector({
                        title: "矢量路网",
                        source: vectorSource,
                        style: new ol.style.Style({
                            // stroke: new ol.style.Stroke({
                            //     color: 'rgba(0,255,0,0.8)',
                            //     width: 4,
                            // }),
                            stroke: new ol.style.Stroke({
                                color: '#0000ff',//颜色
                                width: 3,//宽度
                                lineCap: 'round',//线帽样式
                                //butt:末端添加平直边缘;round:末端添加圆形线帽;square:末端添加方形线帽;
                                lineJoin: 'round'//线条连接处样式
                                //bevel:创建斜角;round:创建圆角;square:创建尖角;
                            })
                        }),
                    }),
                    new ol.layer.Tile({
                        title: "中国矢量注记1-4级",
                        source: new ol.source.WMTS({
                            name: "中国矢量注记1-4级",
                            url: "http://t{0-6}.tianditu.gov.cn/cva_c/wmts?tk=1d109683f4d84198e37a38c442d68311",
                            layer: "cva",
                            style: "default",
                            matrixSet: "c",
                            format: "tiles",
                            wrapX: true,
                            tileGrid: new ol.tilegrid.WMTS({
                                origin: ol.extent.getTopLeft(projectionExtent),
                                resolutions: resolutions,
                                matrixIds: [0, 1, 2, 3, 4, 5, 6, 7, 8, 9, 10, 11, 12, 13, 14]
                            })
                        }),
                    }),
                ],
                view: new ol.View({
                    // 将长沙作为地图中心
                    center: [112.92597770690918, 28.186654954789518],
                    projection: 'EPSG:4326',
                    zoom: 14,
                }),
                controls: [],
            });

            const layerSwitcher = new LayerSwitcher({
                reverse: true,
                groupSelectStyle: 'group'
            });
            olMap.addControl(layerSwitcher);
        </script>
    </body>


</html>
使用VS Code的Live Server插件加载网页:
标签:ol,file,track,PostGIS,cursor,数据量,GeoServer,new,trip 来源: https://www.cnblogs.com/jiujiubashiyi/p/16354063.html
本站声明: 1. iCode9 技术分享网(下文简称本站)提供的所有内容,仅供技术学习、探讨和分享; 2. 关于本站的所有留言、评论、转载及引用,纯属内容发起人的个人观点,与本站观点和立场无关; 3. 关于本站的所有言论和文字,纯属内容发起人的个人观点,与本站观点和立场无关; 4. 本站文章均是网友提供,不完全保证技术分享内容的完整性、准确性、时效性、风险性和版权归属;如您发现该文章侵犯了您的权益,可联系我们第一时间进行删除; 5. 本站为非盈利性的个人网站,所有内容不会用来进行牟利,也不会利用任何形式的广告来间接获益,纯粹是为了广大技术爱好者提供技术内容和技术思想的分享性交流网站。