标签:clustering DBSCan Python df DBSCAN import model outliers data
Chapter 4 - Clustering Models
Segment 3 - DBSCan clustering to identify outliers
DBSCAN for Outlier Detection
- Unsupervised method that clusters core samples(dense areas of a dataset) and denotes non-core samples(sparse portions of the dataset)
- Use to identify collective outliers
- Outliers should make up ≤5% of the total observations. Adjust model parameters accordingly
Important DBSCAN model parameters:
- eps
- min_samples
import pandas as pd

import matplotlib.pyplot as plt
from pylab import rcParams
import seaborn as sb

import sklearn
from sklearn.cluster import DBSCAN
from collections import Counter
%matplotlib inline
rcParams['figure.figsize'] = 5, 4
sb.set_style('whitegrid')
DBSCan clustering to identify outliers
Train your model and identify outliers
# with this example, we're going to use the same data that we used for the rest of this chapter. So we're going to copy and
# paste in the code.
address = '~/Data/iris.data.csv'
df = pd.read_csv(address, header=None, sep=',')

df.columns=['Sepal Length','Sepal Width','Petal Length','Petal Width', 'Species']

data = df.iloc[:,0:4].values
target = df.iloc[:,4].values

df[:5]
| Sepal Length | Sepal Width | Petal Length | Petal Width | Species | |
|---|---|---|---|---|---|
| 0 | 5.1 | 3.5 | 1.4 | 0.2 | setosa |
| 1 | 4.9 | 3.0 | 1.4 | 0.2 | setosa |
| 2 | 4.7 | 3.2 | 1.3 | 0.2 | setosa |
| 3 | 4.6 | 3.1 | 1.5 | 0.2 | setosa |
| 4 | 5.0 | 3.6 | 1.4 | 0.2 | setosa |
model = DBSCAN(eps=0.8, min_samples=19).fit(data)
print(model)
DBSCAN(eps=0.8, min_samples=19)
Visualize your results
outliers_df = pd.DataFrame(data)

print(Counter(model.labels_))

print(outliers_df[model.labels_==-1])
Counter({1: 94, 0: 50, -1: 6})
       0    1    2    3
98   5.1  2.5  3.0  1.1
105  7.6  3.0  6.6  2.1
117  7.7  3.8  6.7  2.2
118  7.7  2.6  6.9  2.3
122  7.7  2.8  6.7  2.0
131  7.9  3.8  6.4  2.0
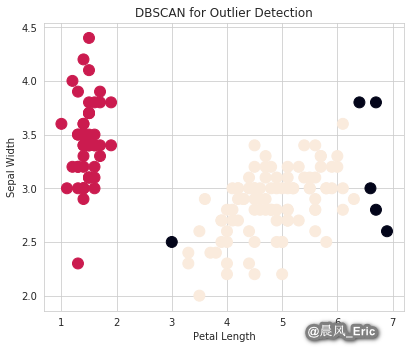
fig = plt.figure()
ax = fig.add_axes([.1,.1,1,1])

colors = model.labels_

ax.scatter(data[:,2],data[:,1],c=colors,s=120)
ax.set_xlabel('Petal Length')
ax.set_ylabel('Sepal Width')
plt.title('DBSCAN for Outlier Detection')
Text(0.5, 1.0, 'DBSCAN for Outlier Detection')
标签:clustering,DBSCan,Python,df,DBSCAN,import,model,outliers,data 来源: https://www.cnblogs.com/keepmoving1113/p/14320912.html
本站声明: 1. iCode9 技术分享网(下文简称本站)提供的所有内容,仅供技术学习、探讨和分享; 2. 关于本站的所有留言、评论、转载及引用,纯属内容发起人的个人观点,与本站观点和立场无关; 3. 关于本站的所有言论和文字,纯属内容发起人的个人观点,与本站观点和立场无关; 4. 本站文章均是网友提供,不完全保证技术分享内容的完整性、准确性、时效性、风险性和版权归属;如您发现该文章侵犯了您的权益,可联系我们第一时间进行删除; 5. 本站为非盈利性的个人网站,所有内容不会用来进行牟利,也不会利用任何形式的广告来间接获益,纯粹是为了广大技术爱好者提供技术内容和技术思想的分享性交流网站。