标签:mpg sb Creating Python Science local cars import data
Chapter 4 - Practical Data Visualization
Segment 6 - Creating statistical data graphics
Statistical Plots Allow Viewers To:
- Identify outliers
- Visualize distributions
- Deduce variable types
- Discover relationships and core relations between variables in a dataset
Histograms
A histogram shows a variable's distribution as a set of adjacent rectangles on a data chart. Histograms represent counts of data within a numerical range of values.
Scatterplots
Scatterplots are useful when you want to explore interrelations or dependencies between two different variables. These data graphics are ideal for visually spotting outliers and trends in data.
Boxplots
Boxplots are useful for seeing a variable's spread, and for detecting outliers.
import numpy as np
import pandas as pd
from pandas import Series, DataFrame

from pandas.plotting import scatter_matrix

import matplotlib.pyplot as plt
from pylab import rcParams
%matplotlib inline
rcParams['figure.figsize'] = 5, 4
import seaborn as sb
sb.set_style('whitegrid')
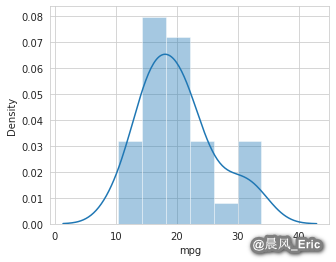
Eyeballing dataset distributions with histograms
address = '~/Data/mtcars.csv'

cars = pd.read_csv(address)

cars.columns = ['car_names','mpg','cyl','disp', 'hp', 'drat', 'wt', 'qsec', 'vs', 'am', 'gear', 'carb']
cars.index = cars.car_names
mpg = cars['mpg']
mpg.plot(kind='hist')
<matplotlib.axes._subplots.AxesSubplot at 0x7f637c0199b0>
plt.hist(mpg)
plt.plot()
[]
sb.distplot(mpg)
/home/ericwei/.local/lib/python3.7/site-packages/seaborn/distributions.py:2557: FutureWarning: `distplot` is a deprecated function and will be removed in a future version. Please adapt your code to use either `displot` (a figure-level function with similar flexibility) or `histplot` (an axes-level function for histograms).
  warnings.warn(msg, FutureWarning)
/usr/local/lib/python3.7/dist-packages/matplotlib/cbook/__init__.py:1402: FutureWarning: Support for multi-dimensional indexing (e.g. `obj[:, None]`) is deprecated and will be removed in a future version.  Convert to a numpy array before indexing instead.
  x[:, None]
/usr/local/lib/python3.7/dist-packages/matplotlib/axes/_base.py:276: FutureWarning: Support for multi-dimensional indexing (e.g. `obj[:, None]`) is deprecated and will be removed in a future version.  Convert to a numpy array before indexing instead.
  x = x[:, np.newaxis]
/usr/local/lib/python3.7/dist-packages/matplotlib/axes/_base.py:278: FutureWarning: Support for multi-dimensional indexing (e.g. `obj[:, None]`) is deprecated and will be removed in a future version.  Convert to a numpy array before indexing instead.
  y = y[:, np.newaxis]


<matplotlib.axes._subplots.AxesSubplot at 0x7f6379883160>
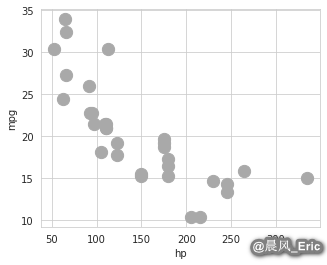
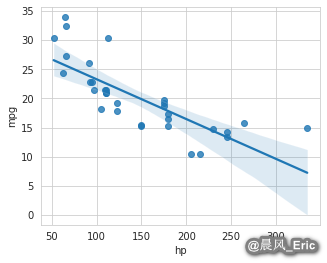
Seeing scatterplots in action
cars.plot(kind='scatter', x='hp', y='mpg', c=['darkgray'],s=150)
<matplotlib.axes._subplots.AxesSubplot at 0x7f637771e240>
sb.regplot(x='hp', y='mpg', data=cars, scatter=True)
<matplotlib.axes._subplots.AxesSubplot at 0x7f6377688470>
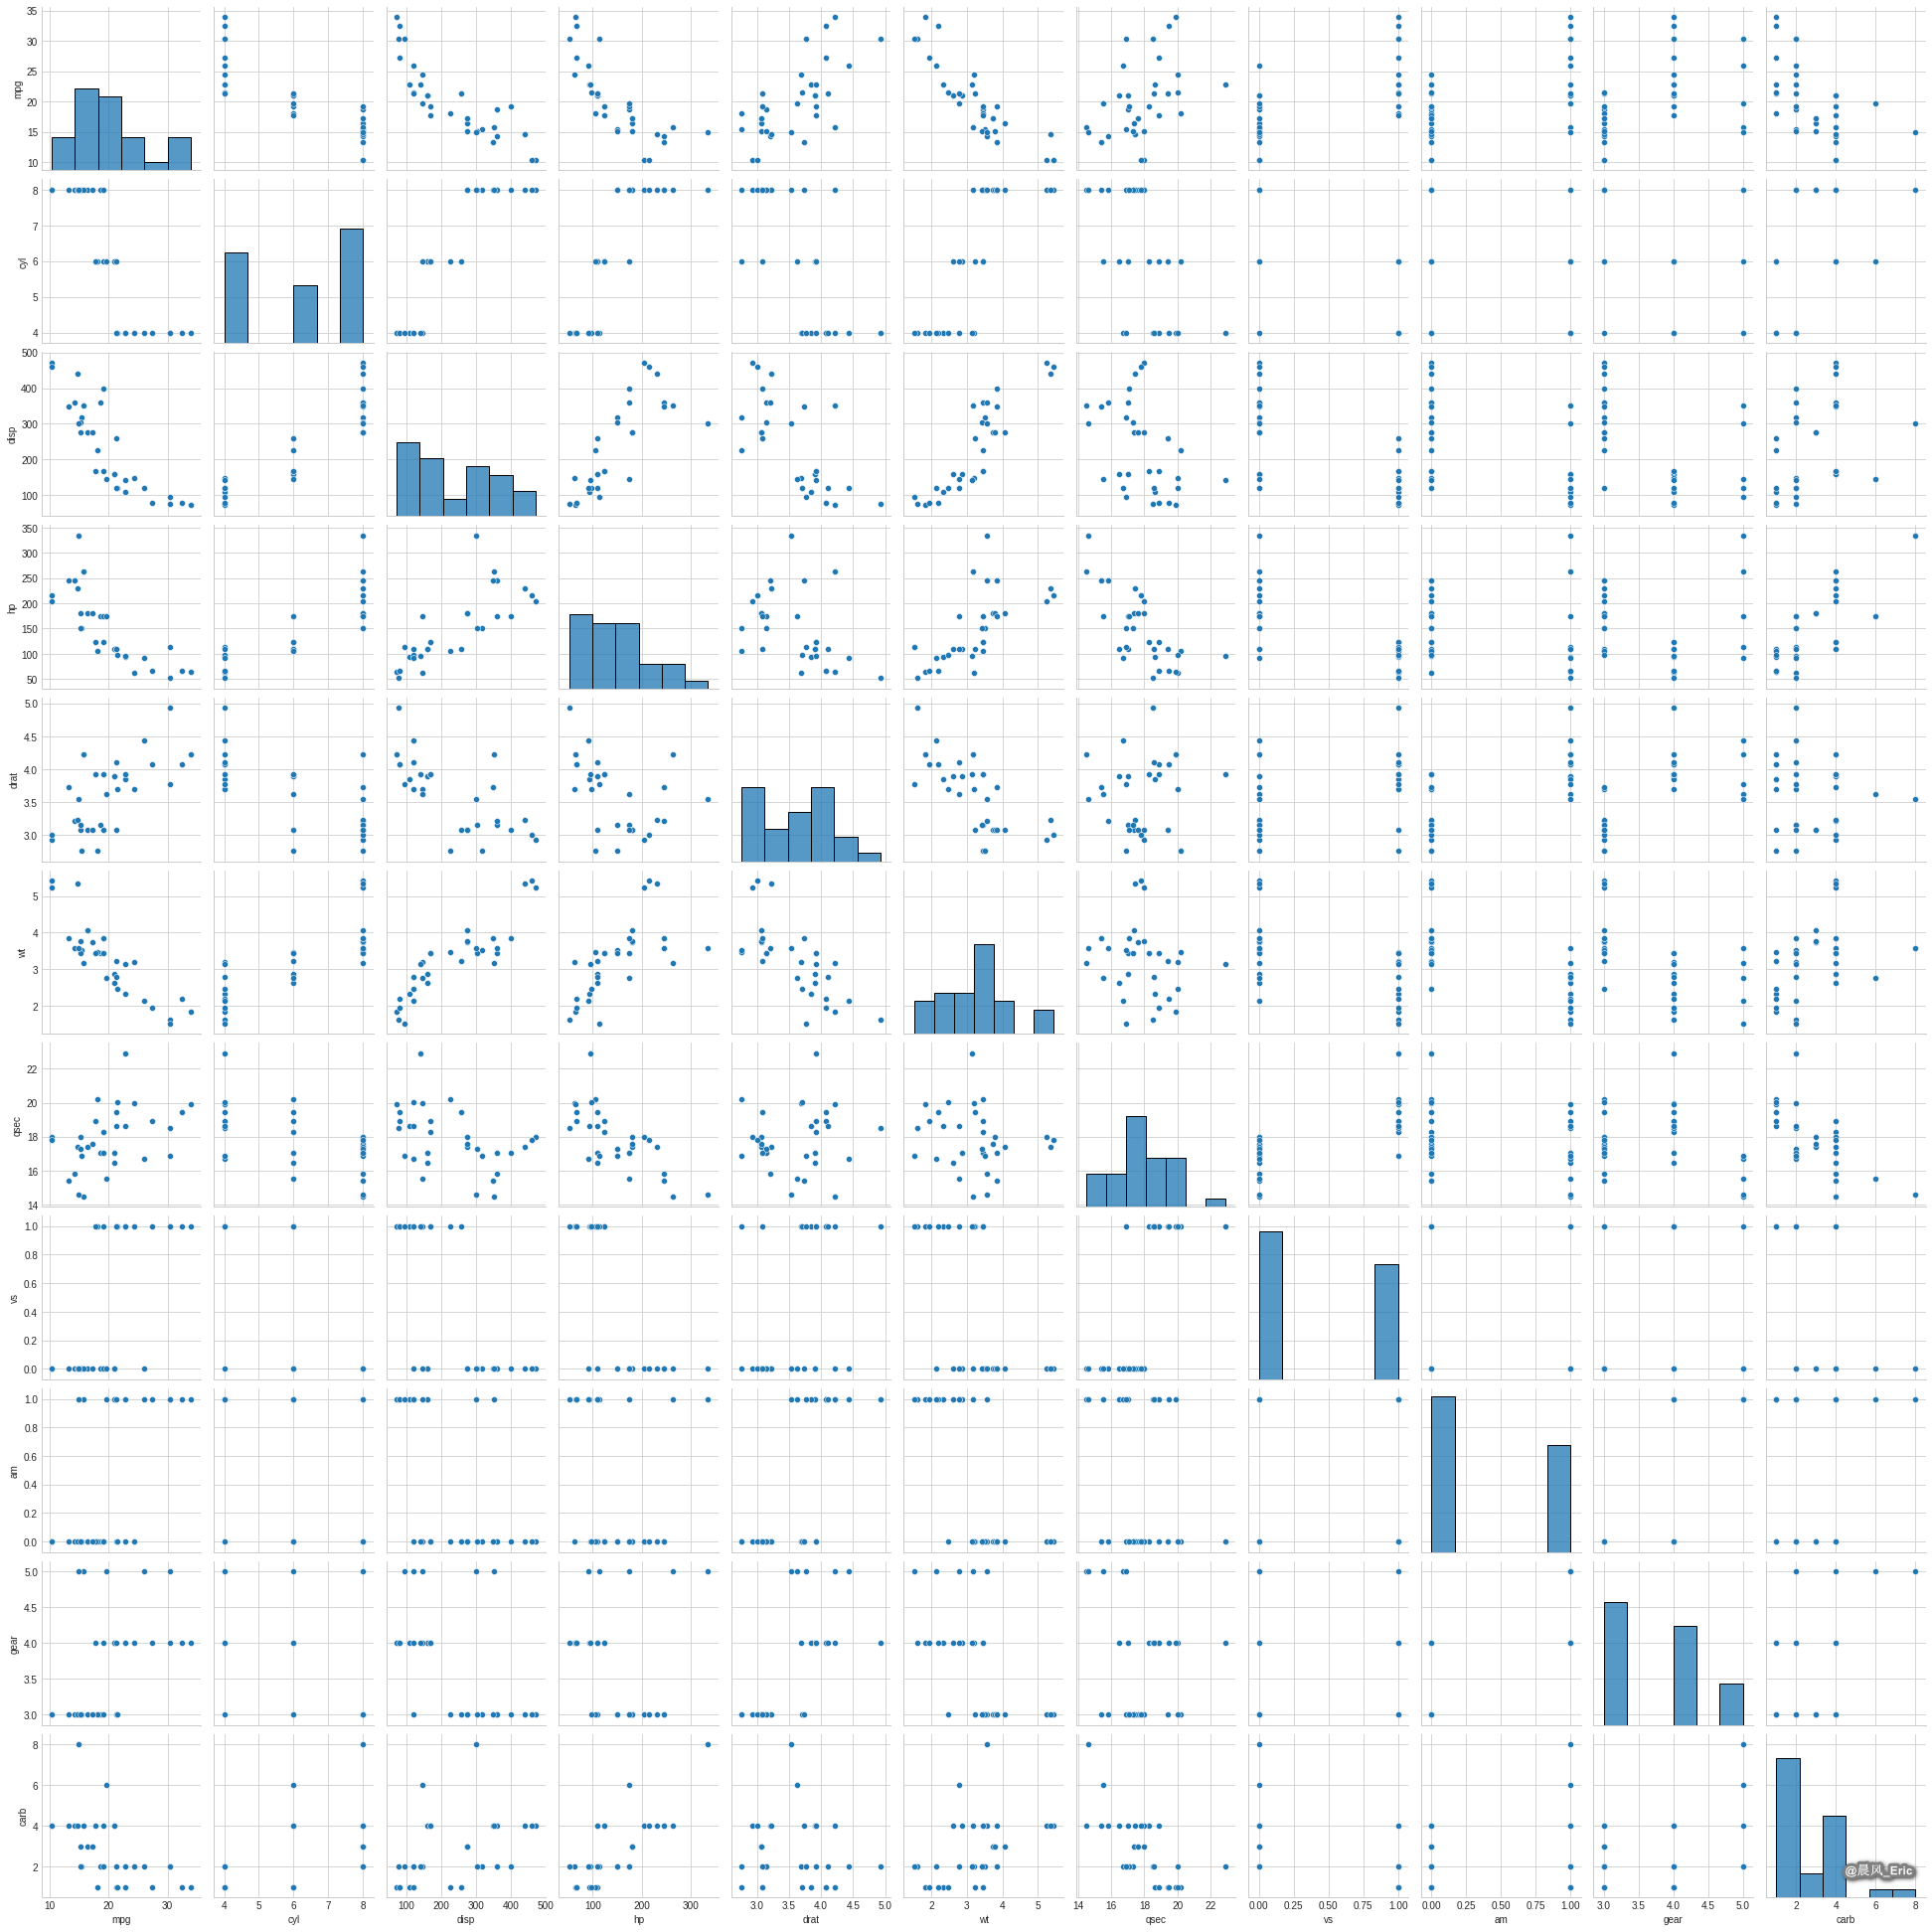
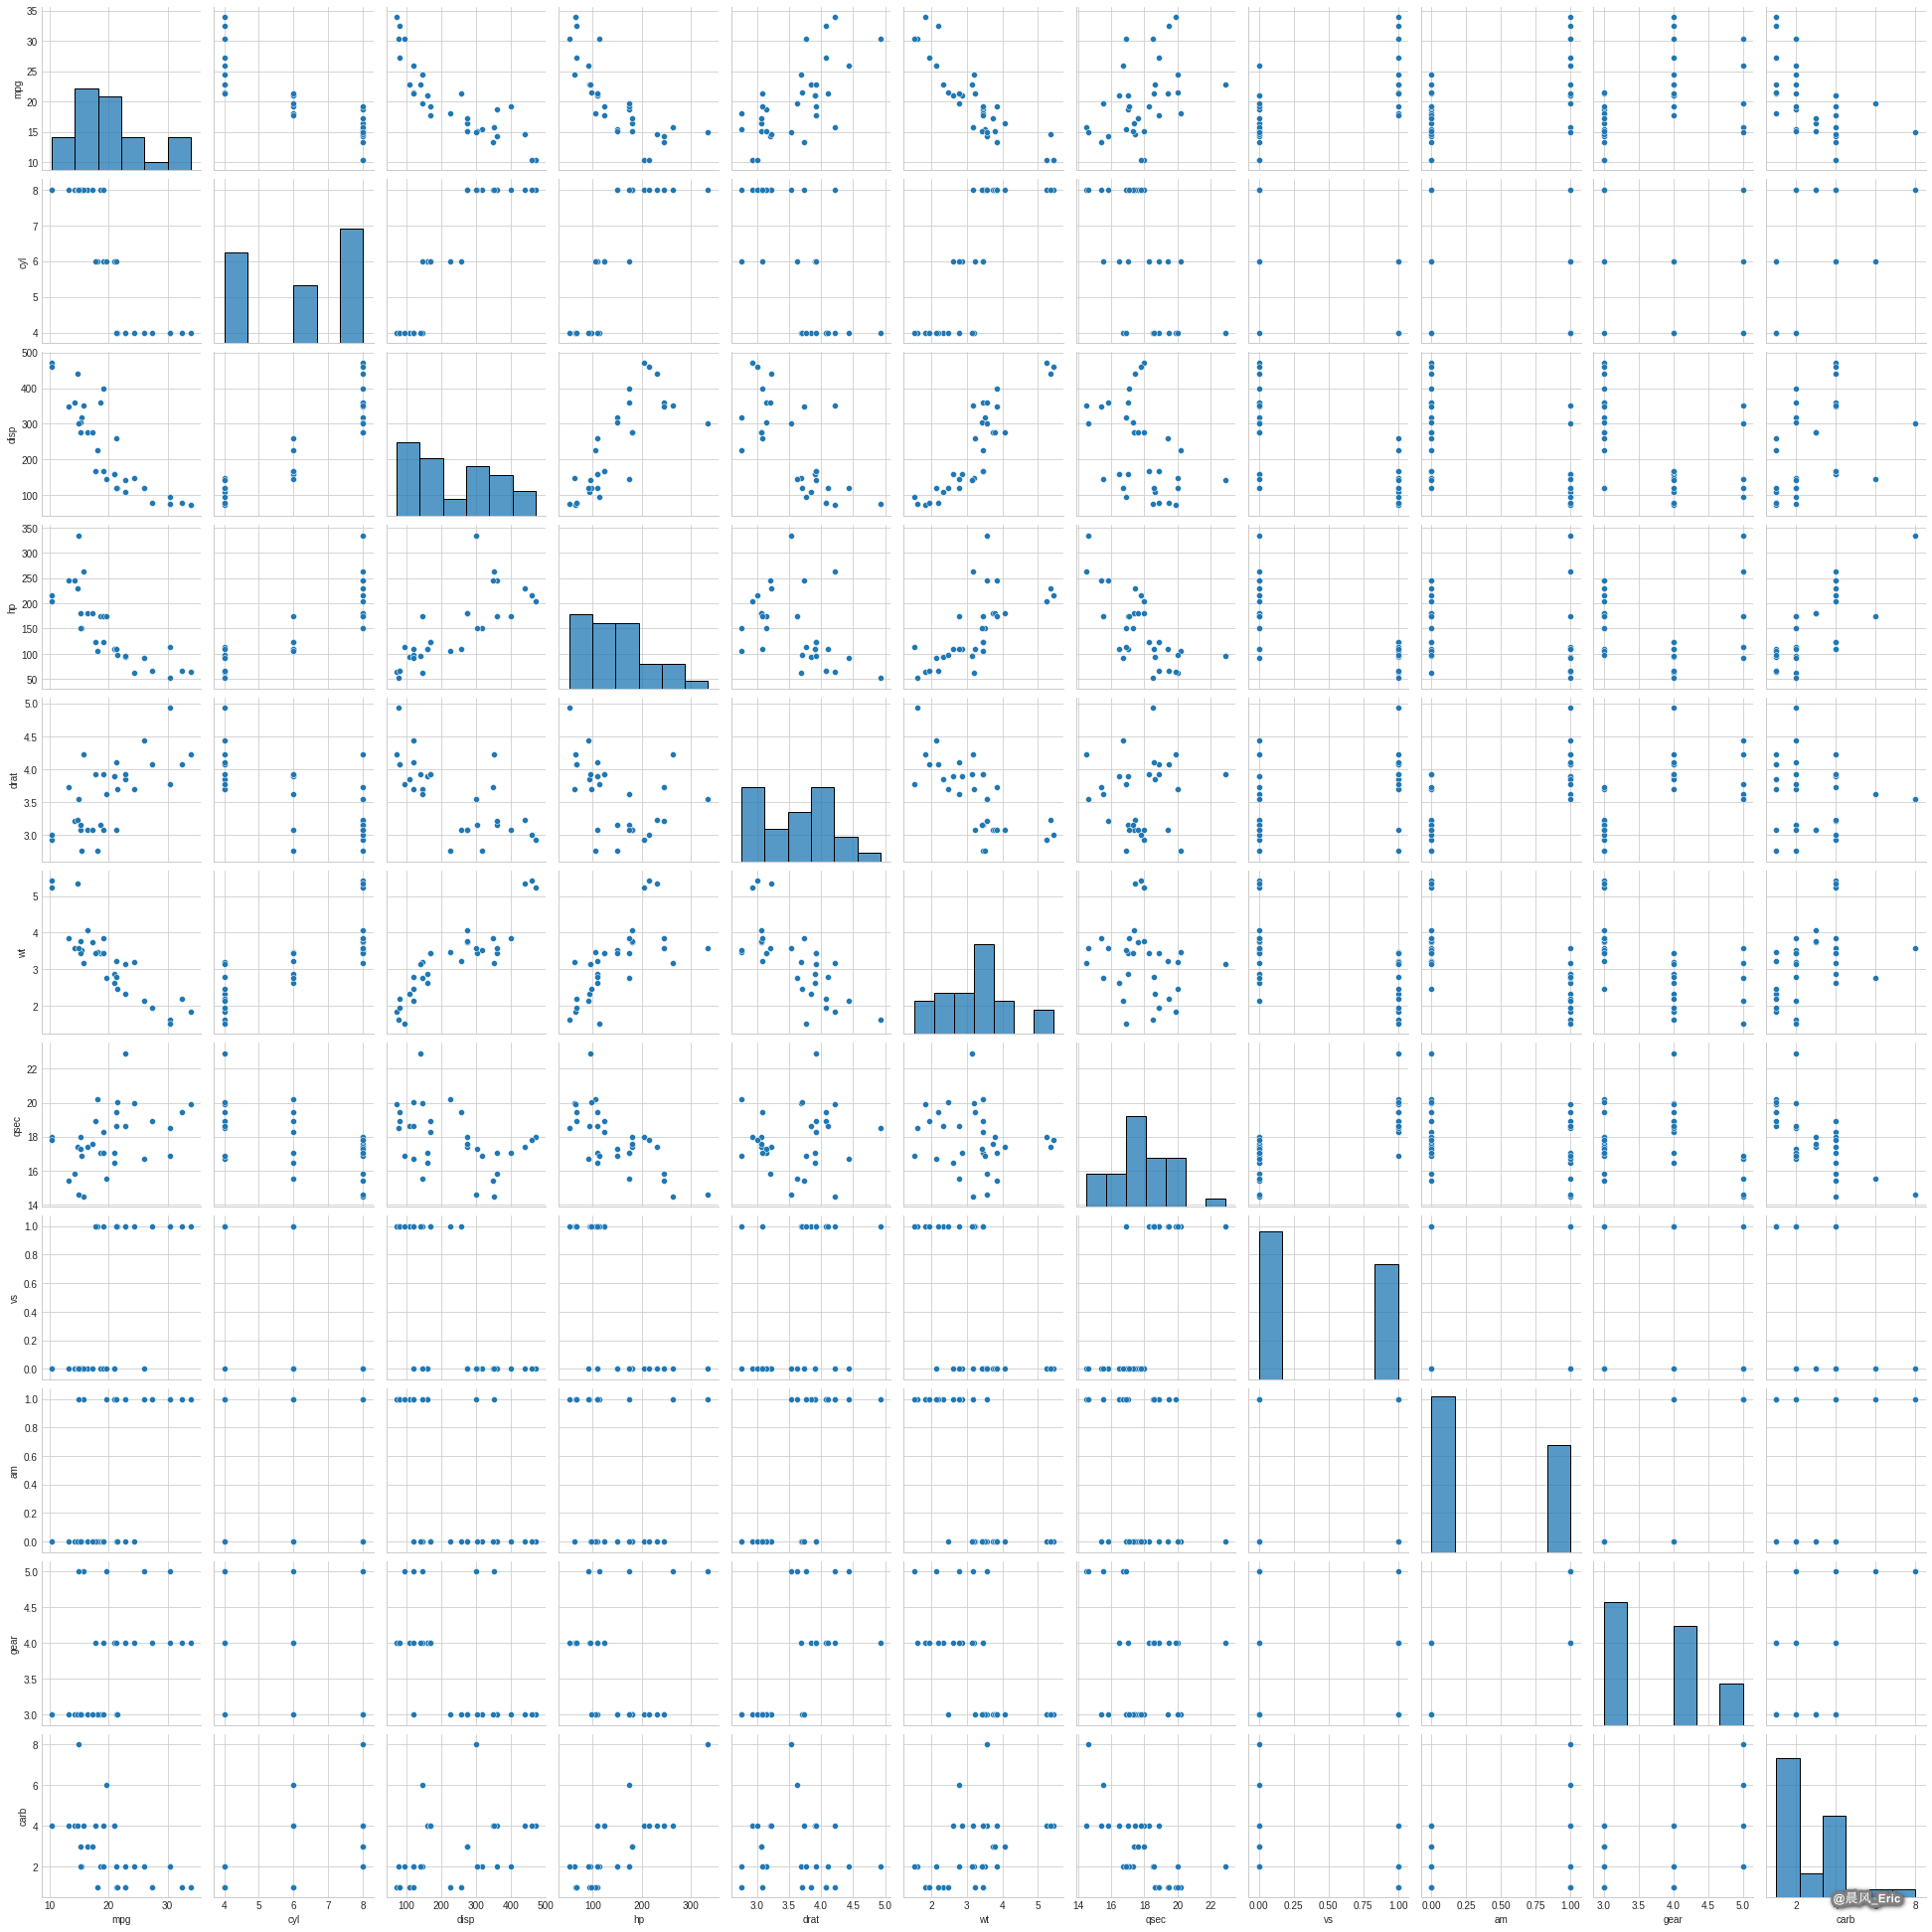
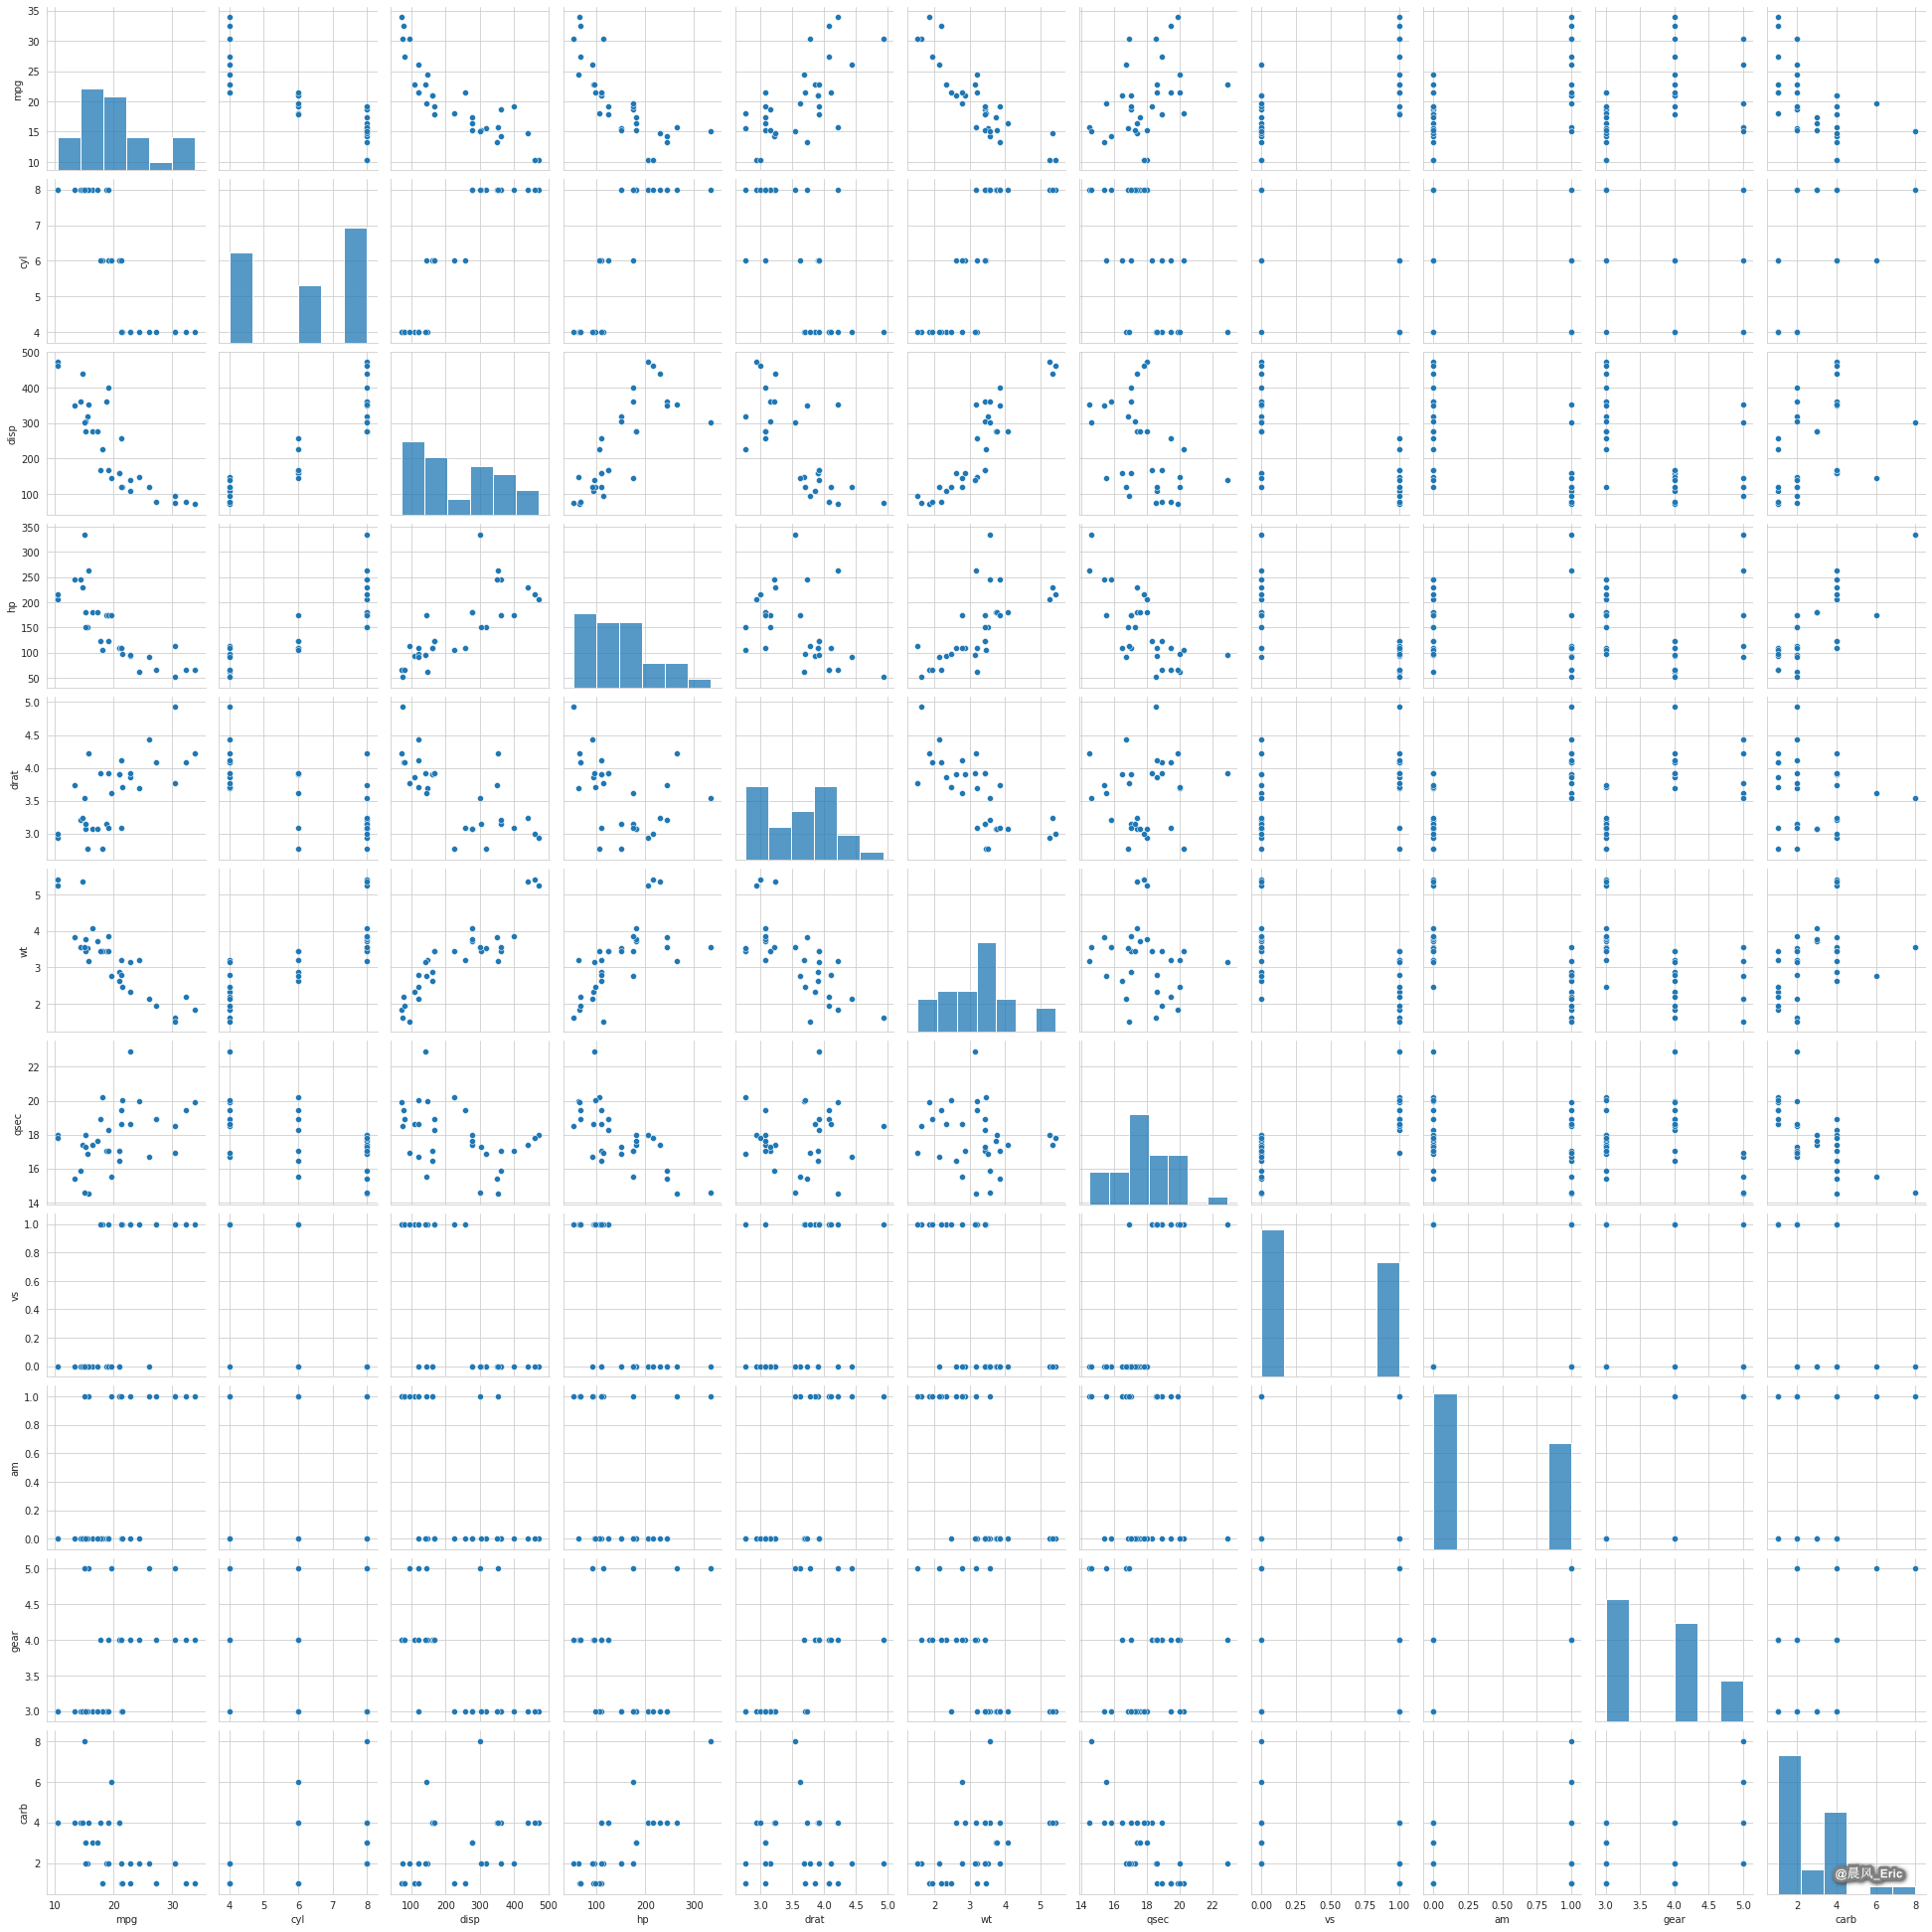
Generating a scatter plot matrix
sb.pairplot(cars)
<seaborn.axisgrid.PairGrid at 0x7f6373f31c88>
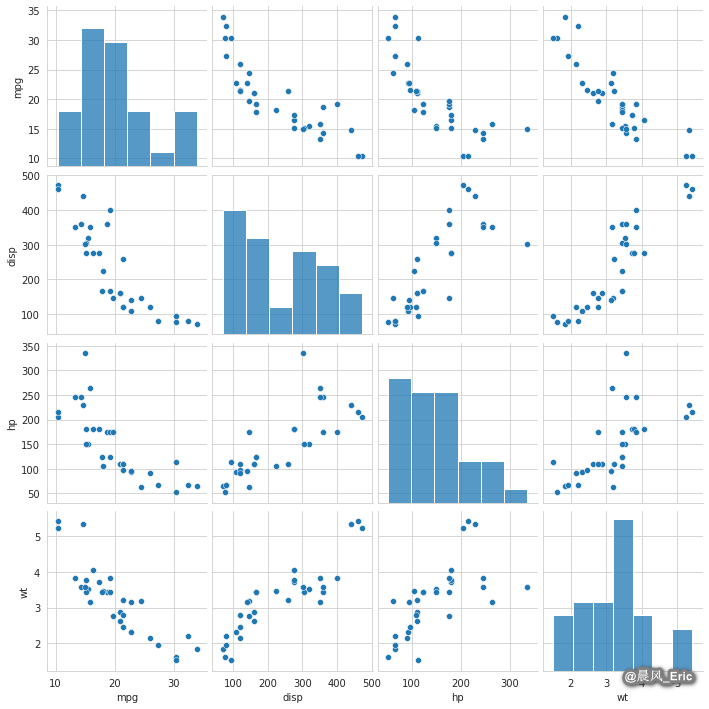
cars_subset = cars[['mpg','disp','hp','wt']]
sb.pairplot(cars_subset)
plt.show()
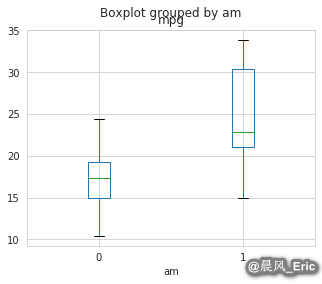
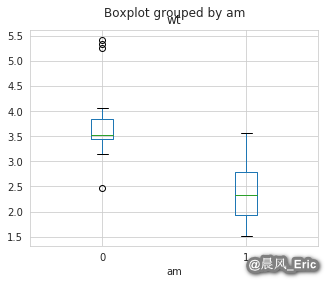
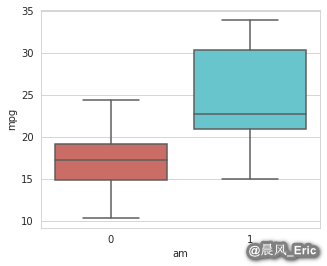
Building boxplots
cars.boxplot(column='mpg', by='am')
cars.boxplot(column='wt', by='am')
/home/ericwei/.local/lib/python3.7/site-packages/numpy/core/_asarray.py:83: VisibleDeprecationWarning: Creating an ndarray from ragged nested sequences (which is a list-or-tuple of lists-or-tuples-or ndarrays with different lengths or shapes) is deprecated. If you meant to do this, you must specify 'dtype=object' when creating the ndarray
  return array(a, dtype, copy=False, order=order)


<matplotlib.axes._subplots.AxesSubplot at 0x7f636875dc88>
sb.boxplot(x='am', y='mpg', data=cars, palette='hls')
<matplotlib.axes._subplots.AxesSubplot at 0x7f636836ae48>
标签:mpg,sb,Creating,Python,Science,local,cars,import,data 来源: https://www.cnblogs.com/keepmoving1113/p/14248546.html
本站声明: 1. iCode9 技术分享网(下文简称本站)提供的所有内容,仅供技术学习、探讨和分享; 2. 关于本站的所有留言、评论、转载及引用,纯属内容发起人的个人观点,与本站观点和立场无关; 3. 关于本站的所有言论和文字,纯属内容发起人的个人观点,与本站观点和立场无关; 4. 本站文章均是网友提供,不完全保证技术分享内容的完整性、准确性、时效性、风险性和版权归属;如您发现该文章侵犯了您的权益,可联系我们第一时间进行删除; 5. 本站为非盈利性的个人网站,所有内容不会用来进行牟利,也不会利用任何形式的广告来间接获益,纯粹是为了广大技术爱好者提供技术内容和技术思想的分享性交流网站。